Updated for Tuesday, September 04 27, 2018 | Trend Watch is updated during the day on Monday of each new week, excluding holidays.
TREND WATCH FOR THE WEEK OF SEPTEMBER 04
What's Happening Now?
Beneath the Tent.
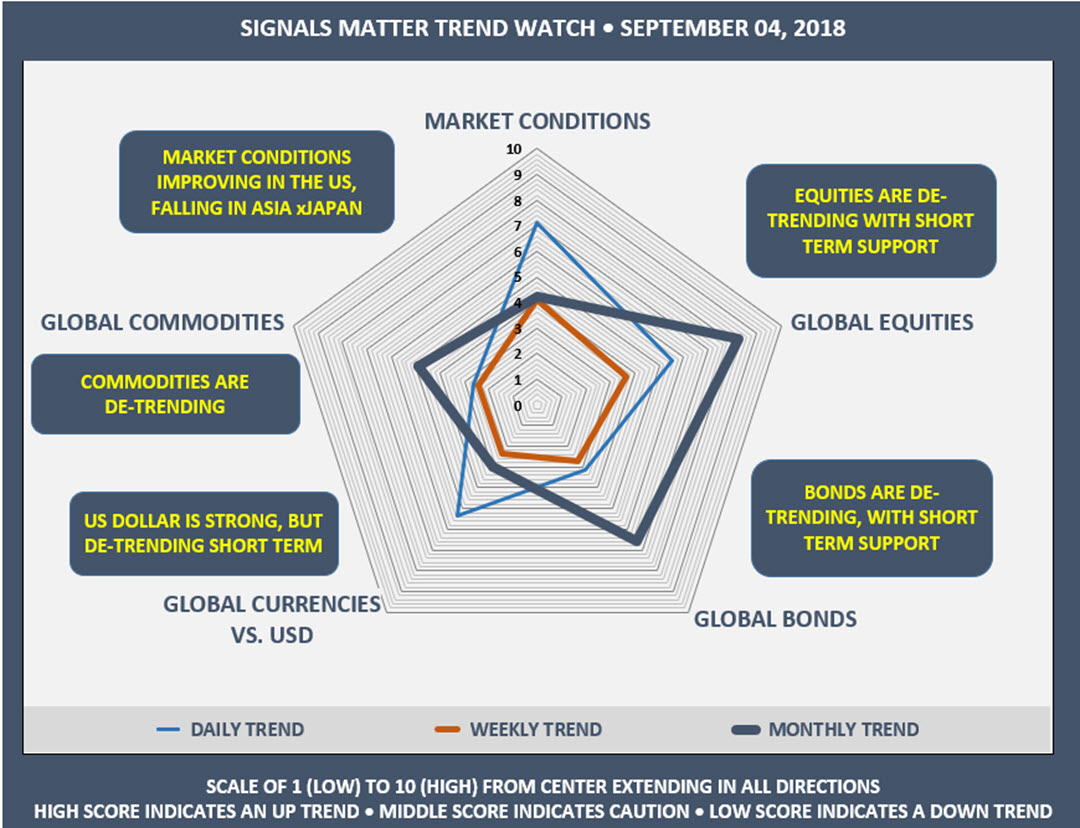
Here’s what the Spider Chart is telling us this week.
What’s notable this week is that daily trends have strengthened across market conditions, stocks, bonds and currencies and we head into September. Please note: Trend Watch is under reconstruction and we expect to publish next week.
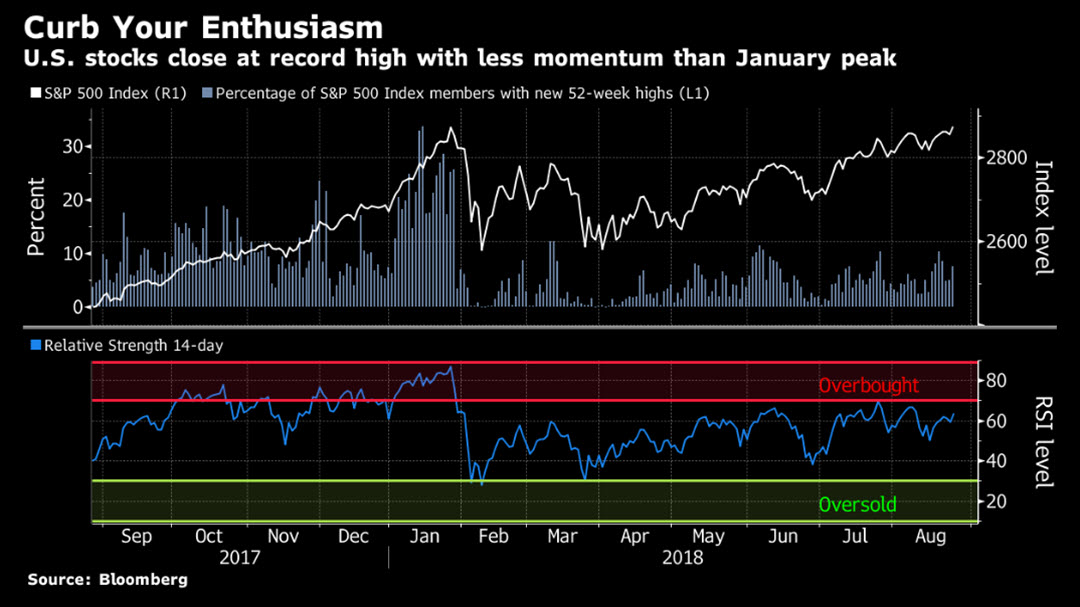
But stocks are up. So, why isn’t the daily trend up, as it is across bonds for example? That’s because, while price is up, momentum is not. Our trending algorithm tests momentum as well as price and as can be seen in the Bloomberg chart below, momentum in the latest rally just isn’t keeping up, so we need to be on-guard here. We have hit a double-top in the SP500 Index, but without the hubris in momentum that normally would accompany if this double top is to be sticky.
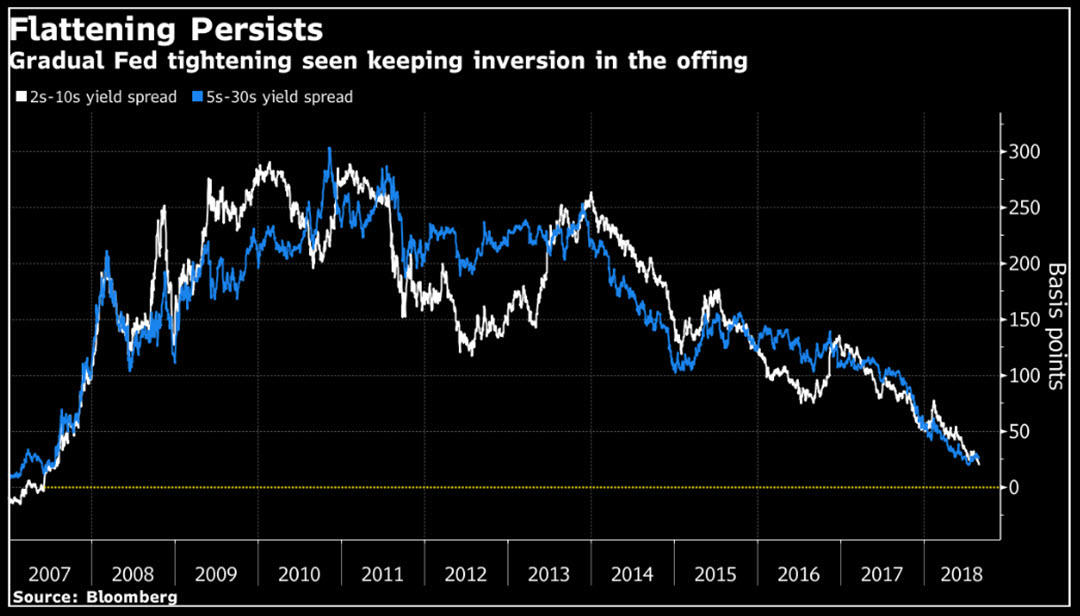
US Treasury Yield Curve Continues to Flatten
Here’s another item lurking in the background of rising stocks – a US Treasury yield curve that continues to flatten, which is an oft-heralded recession indicator (Recession Watch refers). The gap between the 2/10-Year US Treasury Yield Curves fell to 19 basis points last Friday (0.19%), seemingly eager to go flat or negative soon, either (a) on the next Fed rate hike on the short end of the curve or (b) on a surge in bond buying, taking interest rates on the long end down.
The next Fed rate hike is likely in September, based upon a continuing hawkish tone from the Fed and the political expediency of getting another rate hike out of the way before Fall elections in the US so as not to influence election outcomes. (Frankly, September is getting pretty close to having a potential impact, given that the next rate hike could invert the yield curve.) Two more Fed rate hikes on the short end of the yield curve are expected in 2018, and that would do the job of flattening/inverting the curve.
Are We Right on This?
Let's have a look. We don’t have the answer to that but here’s what we do know. Believe what you see, not what you read. On July 18, 2018 (last month), former Fed Chair Ben Bernanke said, “It would be a mistake to think that the unexpected flattening of the US yield curve signals a looming recession." Ben also predicted in January 2008 that there was no recession in site. As it turned out, the Great Recession began in December 2007, one month earlier. It won’t be much longer to see what happens this time.
Our motto - believe what you see ... not what you read. Follow the Signals. With all due respect to Ben, the yield curve IS flattening, unexpected or not, as it has before all recessions since 1970. Unexpected? Not really, when the Fed choses to lower interest rates to nearly zero and leave them there for a decade.
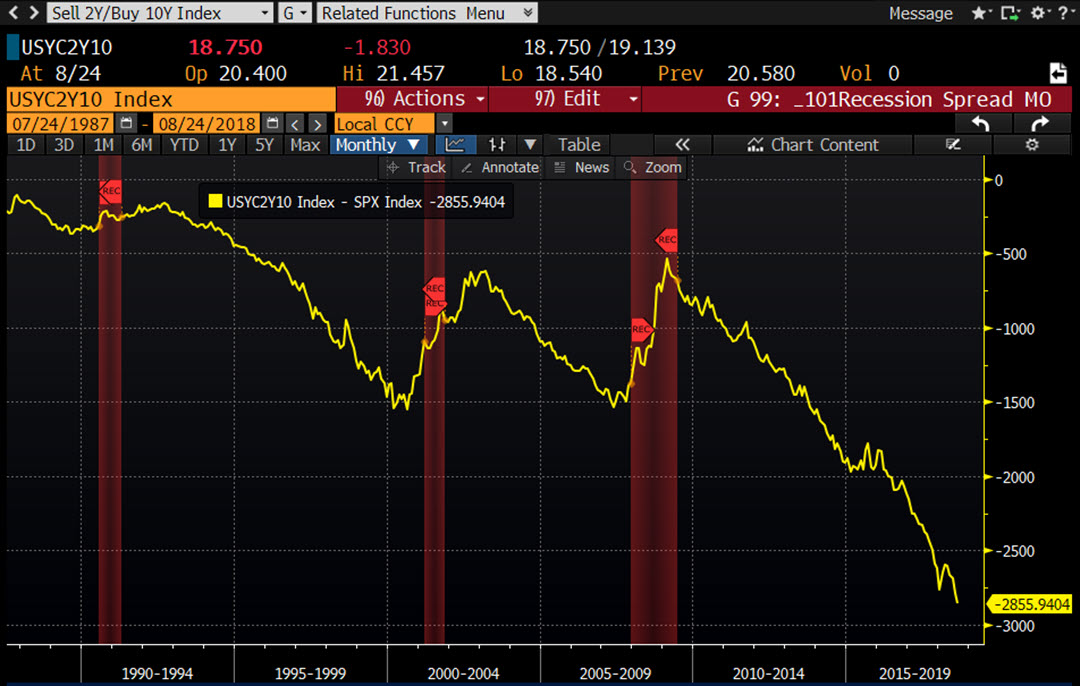
Take a look below, where we have created an overlay of inverting yield curves over past recessions. That’s what we’re seeing – never mind the unexpected part or what we are reading. It’s not about what we want to believe, or others want us to believe. It’s about what we are seeing and battening down the hatches because we are, in sailing lingo, “in irons.”
In Irons?
Sailing vessels are “in irons” when they head dead into the wind, become stalled and are unable to tack to starboard or to port. Once in irons, forward momentum is stopped as the sails (the economic engine) are unable to generate power in the “No-go Zone” below.
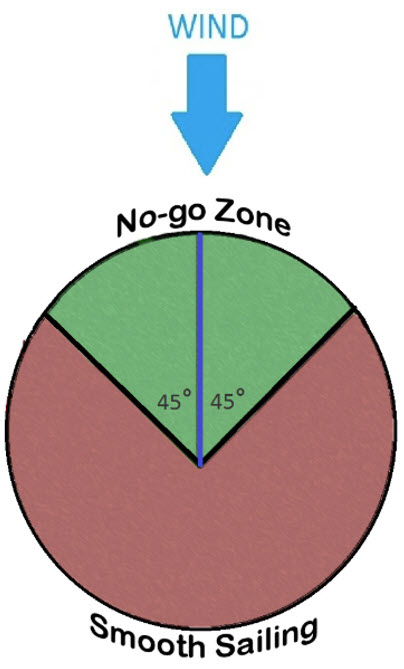
No-go Zone
In the no-go zone the craft's sails cease producing enough drive to maintain way or forward momentum; therefore, the sailing craft slows down towards a stop and steering becomes progressively less effective at controlling the direction of travel. Eventually, a craft in irons will coast to a stop.
Why are we in irons? Because with the passage of time, as a result of relentless easing by the Federal Reserve, we are in this predicament. We are boxed in. Either way you turn the rudder on interest rates, issues abound.
Should long rates rise from here, the bond bubble could pop, heavily taxing overleveraged borrowers, including the Federal government, corporate America and households. Conversely, if long rates fall, the yield curve inverts, a marker for recession.
More Below >>>


Weekly Market Conditions
VOLATILITY, FINANCIAL CONDITIONS AND MANAGED FUTURES.
The Weekly Market Conditions Heat Map shows that Global Market Conditions are de-trending. Volatility, recently low, is now elevated comparatively. Financial Conditions continue to de-trend globally on a weekly basis, with some relief on a daily basis,, except in Asia xJapan. What’s concerning here is that Market Conditions, and Financial Conditions especially, are de-trending across the globe with a high degree of correlation, making all this de-trending all the more meaningful.
[wpdatatable id=7]
Weekly Global Equities
UNITED STATES, EUROPE, ASIA & EMERGING MARKETS.
The Global Equity Heat Map shows a mixed bag of global equity markets, some trending, some cautionary and others in retreat as investors attempt to gauge the impact of a rising US dollar, rising US interest rates and new tariff threats, along with the impact these may have on global growth. What is clear is the Japan and China are weakening.
[wpdatatable id=13]
Weekly Global Bonds
BARCLAY AGGREGATE INDEXES ACROSS THE GLOBE.
The Global Bond Heat Map has all Barclay Global Indexes in retreat across the board as bonds slump and interest rates rise. More regional trends are cautionary, although like equities above, Asia is notably lagging. That would be China. Keep an eye on China. Our August Recession Watch refers. Withe 10-year interest rates falling in the US, flattening the US yield curve, price is up - hence the Barclay US Aggregate is on the rise.
[wpdatatable id=14]
Weekly Global Currencies
NORTH AMERICAN, EUROPEAN AND ASIAN CURRENCIES.
The US Dollar has strengthened (trending up), causing virtually every other currency tracked in USD terms to fall (de-trend) on a weekly basis. Emerging market currencies are close to their all-time lows as liquidity shortages, rising US interest rates and a resurgent US dollar wreak havoc. The Emerging Market selloff is concentrated in countries sporting large current account deficits, namely Argentina, Turkey, Brazil and South Africa and is likely to put a drag on equities globally. Take note though, in the short term the US dollar is struggling.
[wpdatatable id=15]
Weekly Global Commodities
AGRICULTURE, ENERGY, INDUSTRIAL & PRECIOUS METALS.
The Global Commodity Heat Map, recently trending strongly, has changed noticeably this week. While energy remains high (although the short term trend is weakening), Agriculture, Industrial and Precious Metals are all in the penalty box on a weekly basis. If we are late in the growth cycle and commodities are now correcting, that would signal trouble ahead. When late-cycle sectors turn, a turn in the growth cycle may not be that far off.
[wpdatatable id=16]