Historical Performance
From April 2017 through July 2019, Signals Matter provided investment Signals to Subscribers Only via Signals Watch. This service was retired on July 31, 2019, in favor of providing Signal Commentary at our companion website, the Critical Signals Report. Please go to www.CriticalSignalsReport.com to view.
The track record displayed on these pages is historical. These Buy Long, Sell Short, Hold and Exit Position Signals were provided for chosen Stocks and ETFs (Exchange Traded Funds) based upon proprietary algorithms and fundamental overlays which combined, solved for entering long-side trades when selected securities were oversold, and entering short-side trades when selected securities were overbought. Signals were triggered weekly and would remain established pending technical or fundamental violation, at which time Signals were exited.
Historical Performance
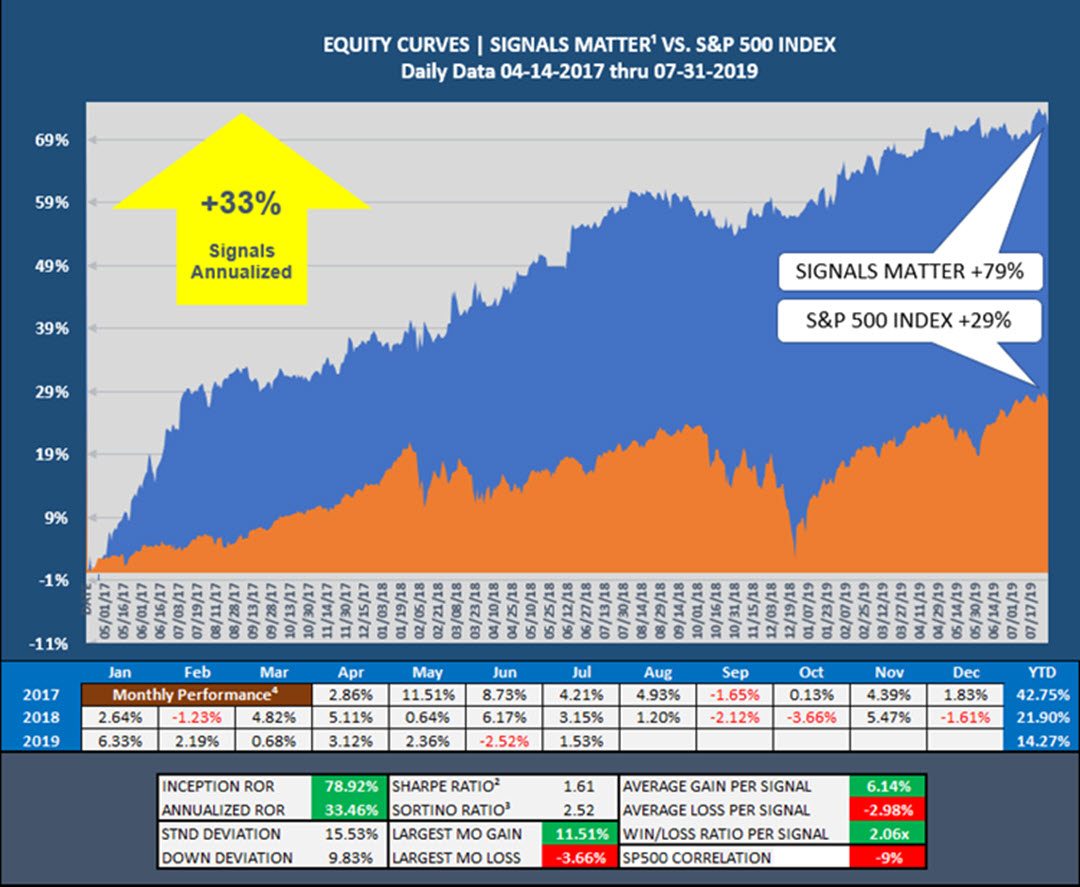
Signal Performance from April 13, 2017 (Inception) through July 31, 2019:
- Signals Matter: Up 79%
- S&P 500 Index: Up 29%
Signal performance was up 50 percentage points (5,000 basis points) over the SP500 Index from Inception to July 31, 2019.
¹ Performance presented is verified by Signals Matter to reflect the model performance an investor may have obtained had it fully invested in each Signal (long and short) posted by Signals Matter from April 14, 2017 to the date reflected above and does not represent performance that any investor actually attained. Trade size and commissions are not considered. Model performance presented is based upon Signals Matter proprietary algorithms and fundamental overlay which combined, solve for entering long-side trades when selected securities are oversold, and entering short-side trades when selected securities are overbought. Long and Short Signals are triggered weekly and remain established pending technical or fundamental violation, at which time Signals are exited. Entry and Exit daily and weekly closing price data is sourced from Bloomberg LP. There can be no assurance that an investor will achieve profits or avoid incurring substantial losses by investing in the Signals presented by Signals Matter. ² Sharpe Ratio measures the risk-adjusted performance of an investment by measuring the return of a trading strategy per unit of standard deviation, typically referred to as risk. The Sharpe Ratio above has been modified to exclude consideration of the risk-free rate in the numerator. ³ Sortino Ratio is a modification of the Sharpe Ratio above that penalizes only those periodic returns less than zero, to measure downside volatility only, rather than both upside and downside volatility as with the Sharpe Ratio. Signals Matter considers the Sortino Ratio a better measure of return-generating efficiency as it does not penalize returns for upside volatility. ⁴ Monthly Returns are daily returns summed for the month; Annual Returns are monthly returns compounded for the year. Returns from Inception are daily returns summed for the period, then annualized. Past performance is not necessarily indicative of future results. Copyright © 2018 Signals Matter, LLC. All rights reserved.