
Tracking Storms
This edition of Party-On or Hunker Down 8.0 provides a timely update on Storm Tracker — our proprietary tool for identifying when markets remain bullish (Party-On) or when conditions begin shifting toward a more defensive, Hunker Down posture.
Lately, financial markets have been firmly Party-On, supported by ample liquidity and suppressed volatility. But as we move into early Fall, we signal to those who follow us that markets may be pressing into bubble territory and approaching a period of tightening liquidity, wobbly credit conditions, and rising inflation pressures. Should the U.S. Federal Reserve pivot toward inflation control by raising interest rates, stock market upside may be capped in the months ahead as downside risk quietly expands.
Protecting capital requires more than simply reducing equity exposure — Wall Street’s default reaction. When markets begin to swoon, our process shifts: we rebalance into short positions and go long volatility. Storm Tracker guides Subscribers through these transitions, helping them re‑position portfolios proactively, sidestep turbulence, and avoid Main Street pain.
Markets Strike New Highs
U.S. and global markets have delivered strong year‑to‑date gains in 2026, extending the Party‑On momentum we highlighted in January’s Party-On or Hunker Down 7.0. This year’s rally has been powered by resilient earnings, expanding AI‑driven capital spending, and broader participation beyond the mega‑cap tech leaders.
Year to date, the Dow Jones Industrial Average (INDU) is up 10.7%, the S&P 500 has gained 12.8%, and the Nasdaq‑100 has surged 16.7%. Global equities have kept pace as well, with the Bloomberg World Large & Mid Cap Price Return Index up 12.9%. In short, 2026 has been defined by record index highs, strong tech‑sector momentum, and steady consumer demand — even as inflation and geopolitical risks create periodic volatility.
From Hype to Hard Reality: A Market Turning Point
As long as earnings continue to surprise and liquidity remains supportive, it’s still Party‑On. Yet history shows that momentum‑driven rallies eventually pause when valuations outrun fundamentals or policy turns restrictive. While AI hasn’t run its course, the market is clearly shifting from hype‑driven expansion to proof‑of‑profit execution — meaning the next leg of gains depends on real revenue, real margins, and real adoption rather than narrative alone.
Several forces could disrupt the market’s rhythm before year‑end: a re‑acceleration in inflation that keeps the Fed tighter for longer, an earnings stumble in the AI supply chain, a geopolitical shock affecting energy or trade routes (the Iran War by example), or a credit event in commercial real estate or regional banking that exposes how fragile leverage has become.
Storm Tracker’s Risk Gauge Leaps Toward Caution
Storm Tracker is our monthly compendium of market narratives, charts, and data designed to educate Subscribers and deliver timely, actionable insights into market conditions and portfolio positioning. It serves as a critical companion to our Model Portfolio selection process, especially as market risks rise and recession pressures begin to build. In recent months, Storm Tracker has climbed from the mid‑20s to 46% in July — a meaningful shift. Let’s take a closer look.
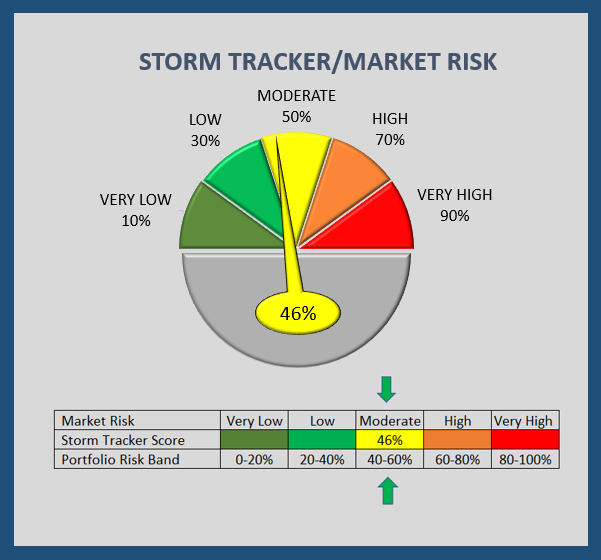
Storm Tracker’s 16 risk components now signal a 46% probability of a market downturn and the early stages of a potential recession within the next 6–12 months. That probability has been steadily climbing, reflected each month in the tables and charts we publish for Subscribers on the Signals Matter website, along with detailed commentary. Each indicator is categorized across low, medium, and high risk, giving a clear view of what remains stable, where pressures are building, and where risks are most acute.
Each month we publish 16 charts for Subscribers that form the foundation of Storm Tracker. Below, we spotlight four high‑risk indicators that have captured our risk‑avoidance attention. When conditions shift, it’s the high‑risk signals that matter most. Below we focus on four of them: the Buffett Indicator (#3), U.S. Treasury Spreads (#8), Stocks vs. the Federal Funds Rate (#9), and Fear vs. Greed (#11).

The Buffett Indicator (#3)
The Buffett Indicator is a long‑term valuation gauge that compares the total value of the U.S. stock market to the size of the U.S. economy (GDP). In simple terms, it measures how “expensive” equities are relative to economic output. When the ratio is very high, markets are richly valued and potentially in bubble territory; when it’s low, stocks are considered cheap. Warren Buffett has described it as one of the best single measures of overall market valuation.

Total U.S. stock‑market capitalization has surged far beyond the size of the underlying economy, with the Buffett Indicator sitting at extremely elevated levels — well above where it stood before both the 2007–2009 Great Recession and the 2020 Covid downturn. Market cap continues to climb while GDP rises more slowly, pushing valuations into historically stretched territory.
In short, the market is priced far richer than the economy beneath it — a classic late‑cycle signal that has preceded major corrections in the past. Risk: High @ 75%.
US Treasury Spreads (#8)
U.S. Treasury spreads measure the differences between yields on short‑term and long‑term Treasury securities — most commonly the 3‑month vs. 10‑year and 2‑year vs. 10‑year spreads. These spreads are widely used as recession indicators because when short‑term rates rise above long‑term rates (an inversion), financial conditions tighten and growth expectations weaken. Historically, every modern U.S. recession has been preceded by an inverted yield curve.
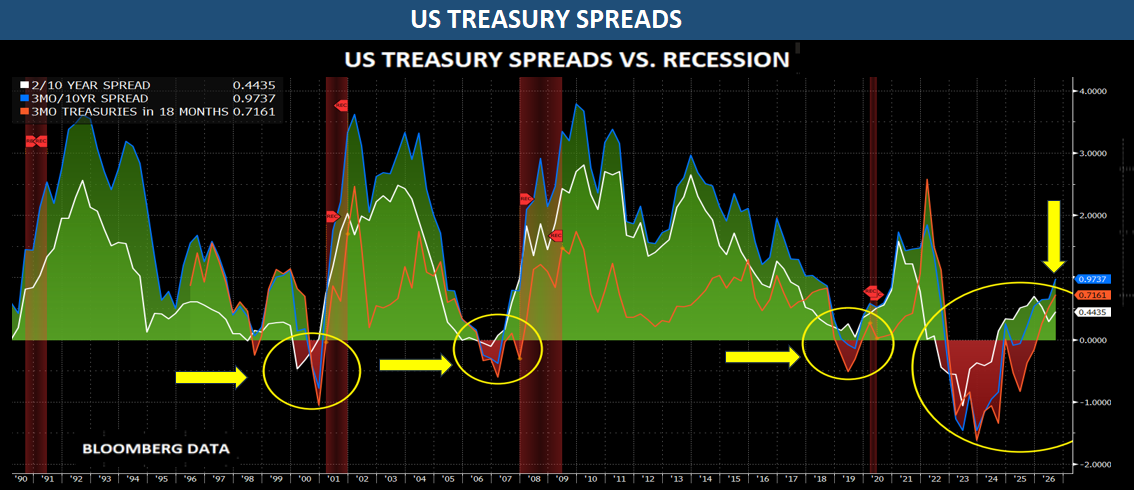
Multiple U.S. Treasury yield spreads have moved back above zero after a long inversion, but all three remain in zones that have historically preceded recessions. Past downturns have consistently followed periods when these spreads dipped negative, and while the recent steepening offers some relief, the pattern of prior cycles suggests the economy is still transitioning out of an inversion — a phase that typically signals late‑cycle risk.
In short, the yield curve has improved but remains in a historically cautionary posture. Risk: High @ 75%.
Stocks vs. the US Federal Funds Rate (#9)
The U.S. Federal Funds Rate is the short‑term interest rate that banks charge one another for overnight loans of reserves held at the Federal Reserve. While the Fed doesn’t set the rate directly, it targets a specific range and uses open‑market operations to keep it there. The Federal Funds Rate anchors all other U.S. interest rates and remains the Fed’s primary tool for tightening or easing financial conditions.
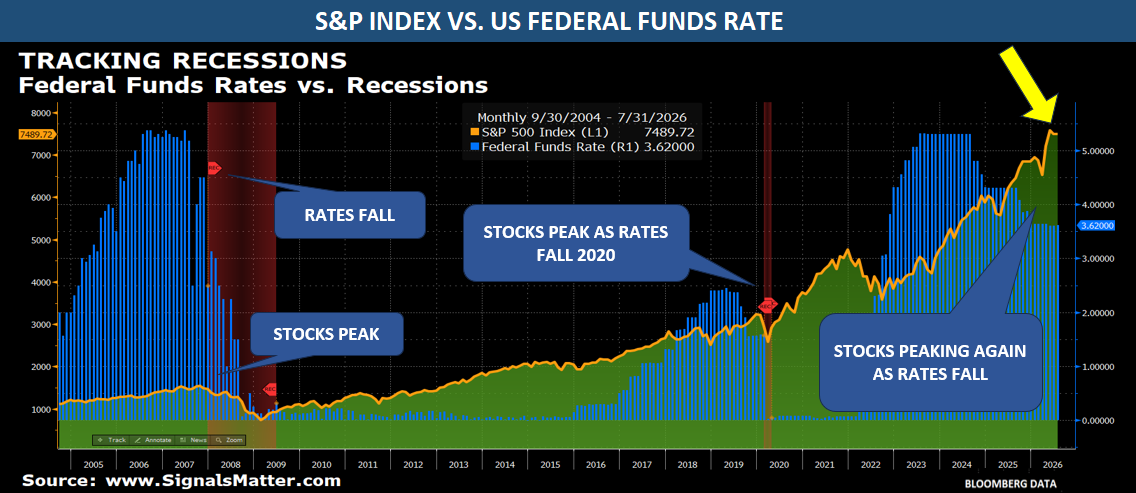
The S&P 500 is once again peaking as interest rates fall — a pattern that has repeatedly appeared ahead of past recessions. Each prior cycle shows the same sequence: the Fed cuts rates, stocks make a final push higher, and recession follows soon after.
In short, today’s setup mirrors 2007–2008 and 2020, with equities at new highs while the Federal Funds Rate declines — a classic late‑cycle environment in which falling rates are not bullish but instead a warning that economic stress is building beneath the surface. Risk: High @ 75%.
Fear vs. Greed (#11)
The Fear/Greed Index is a market‑sentiment gauge created by CNN Business that measures whether investors are leaning toward fear or greed. It blends seven indicators — including price momentum, market breadth, options activity, volatility, and demand for safe‑haven versus riskier assets — into a single score ranging from 0 (Extreme Fear) to 100 (Extreme Greed). High readings signal late‑cycle complacency, while low readings reflect stress and rising risk aversion.

Investor sentiment for the S&P 500 has shifted decisively, with our Fear/Greed readings showing a steady erosion of greed and a clear turn toward fear — a sign that the market’s earlier optimism has broken and late‑cycle caution is now in control.
In short, the Nasdaq is confirming the same pattern. Greed has fallen sharply and sentiment has turned negative, reinforcing that investors are no longer in a risk‑embracing posture but are instead moving into a fear‑driven environment consistent with a broader corrective phase. Risk: High @ 75%.
Why Bubble Risk is Back on the Table
Storm Tracker’s high‑risk components make it tempting to call the U.S. equity market a bubble, but its low‑ and medium‑risk indicators still reflect a Party‑On environment, suggesting that underlying momentum remains broadly supportive for now.
Even so, there are solid reasons why today’s explosive trajectory in AI may be edging into bubble territory. Early‑stage AI demand is being fueled by rapid profit growth, widening margins, and elevated valuations — conditions that often accompany periods of outsized enthusiasm and aggressive capital allocation. As investment flows chase early winners, expectations can compound quickly, reinforcing the belief that exceptional growth will continue uninterrupted.
But bubbles rarely unwind gently. Historically, once demand begins to level off, the feedback loop can reverse with surprising speed. Cash flows compress, profitability comes under pressure, and valuations recalibrate as investors reassess how much future growth they are willing to pay for. What begins as a cooling of demand can cascade into tighter financing conditions, slower investment, and a broader reset in expectations.
The Cycle Is Beginning to Shift
Party On or Hunker Down 8.0 makes one point clear: the market’s payoff structure is shifting. Upside is narrowing, downside is widening, and asymmetry is no longer working as much in investors’ favor as Storm Tracker advances to a 46% probability of turbulence ahead. At Signals Matter, we maintain the flexibility to short stocks when conditions deteriorate and to go long volatility when market stress becomes dominant.
Our daily Portfolio Suggestion Updates are built for these moments. When asymmetry turns against investors, we don’t wait for losses to accumulate. We adjust. We hedge. We position model portfolios to benefit from the very pressures that undermine traditional allocations. That is how we stay ahead of the cycle rather than be defined by it.
If you are not yet following our signals, now is the time. With Storm Tracker steadily rising, the transition from Party-On to Hunker Down is already underway. Investors who respond early are the ones who preserve capital and seize opportunity. Join us as we navigate this next phase with discipline, clarity, and a strategy designed for asymmetric markets.
By staying data‑driven, adjusting exposures, shorting where weakness emerges, and using volatility as a source of protection rather than pain, we navigate the cycles with intention. Successful investing is not about guessing the coin toss — it is about understanding who holds the upside, who holds the downside, and positioning accordingly.
A Sharper Way to Navigate Market Risk
While traditional wire houses continue to rely on static allocations and backward‑looking assumptions, we take a different path. We treat markets as dynamic, data‑driven systems that require constant measurement, disciplined risk controls, and tactical flexibility. That difference isn’t cosmetic — it’s structural. It’s why our strategy adapts faster, protects better, and captures opportunities others miss.
In a market defined by shifting asymmetry, investors can’t afford to navigate blind. They need a process that identifies when upside is narrowing, when downside is expanding, and when protection — not complacency — becomes the rational choice.
That is precisely why our signals matter. For $97 a month, with no lock‑ups and the freedom to cancel at any month‑end, investors gain access to a disciplined framework that adapts as conditions change, highlights where risks are building, and shows how to position when markets transition from Party-On to Hunker Down. In a world where the payoff structure can flip without warning, having a clear, data‑driven guide is more than a luxury; it is a necessity.
Wall Street wire houses typically respond to rising rates by reducing stock exposure and adding bonds — a reaction that makes little sense. Bonds fall when rates rise, creating a perfect storm for traditional investors as stocks and bonds decline together.
Positioning ahead of a recession isn’t about timing the first month — it’s about aligning the portfolio before the dominos fall, while markets are still complacent. Traditional 60/40 portfolios often struggle in inflation‑sticky environments because stocks and bonds can come under pressure at the same time.
Our approach adapts rather than passively absorbs market shocks: we de‑risk early, rotate toward resilient assets, and use protective tools such as inverse ETFs and long‑volatility exposures to turn stress into potential gain. Here are a few tickers worth exploring: DOG, SH, PSQ, TBX, TBF, TAIL, and SWAN.
Full Access to a Smarter Framework
Signals Matter delivers actively managed, all‑weather portfolios designed to perform in both rising and falling markets. With a disciplined allocation across individual stocks and diversified ETFs — investing long and short — we blend growth potential with volatility control and downside protection, unconstrained by traditional benchmarks.
Signals Matter Market Reports are available free of charge at www.SignalsMatter.com, on LinkedIn, and directly to your inbox when you Sign Up Here. Our actively managed portfolios, recession matrices and more are available to Subscribers who Join Here. For access to our hedge fund that trades our Portfolio Suggestions, or to discuss a private-equity opportunity, we invite you to Explore Direct Invest and to Book a Meeting with us.