Markets Surge: How Long Will It Last?
Following the release of Party-On or Hunker Down 4.0, the stock market staged a powerful rebound after a volatile spring marked by reciprocal tariffs and an AI-driven sell-off. Major indexes have since soared to record highs, with the Dow Jones Industrial Average up 5.53% year-to-date, the S&P 500 gaining 9.64%, and the Nasdaq-100 climbing 12.76%—marking the fastest recovery from a 20% drawdown in history. Big Tech and industrials led the charge, while easing inflation and renewed investor optimism fueled a global rally.
Cracks Beneath the Surface: Labor Weakness and Valuation Concentration
While headline indexes continue to climb, underlying economic signals suggest a more fragile foundation. Cooling labor markets, rising unemployment claims, and declining hiring rates point to weakening consumer demand and a potential slowdown in economic momentum. Despite strong corporate earnings on the surface, growth is narrowly concentrated in a few sectors—primarily tech—while many companies report disappointing results. Market gains are increasingly driven by a handful of mega-cap stocks like Nvidia, Microsoft, and Meta, whose combined valuations now account for over 20% of the S&P 500’s total market capitalization. This concentration raises concerns about diversification and the sustainability of the rally.
Tariffs, Commodities, and Inflation: A Brewing Storm
Tariff rates are climbing sharply, especially on industrial goods, fueling inflationary pressures by driving up input costs across sectors. Commodity markets are reacting with heightened volatility—copper prices, for instance, surged over 40% before collapsing 24% in July following a surprise exemption on refined copper imports. These swings reflect deep uncertainty in global supply chains and trade policy. Market-based inflation forecasts have rebounded to levels last seen in April, reigniting concerns about future rate hikes. Meanwhile, the White House is pressuring the Federal Reserve to lower rates, setting up a potential clash between political demands and monetary policy discipline.
Elevated Debt and Fiscal Strain: A Growing Concern
The U.S. debt-to-GDP ratio currently stands between 121% and 124%, meaning the national debt exceeds the country’s annual economic output. While this is below the pandemic-era peak of 135%, it remains historically high and signals potential fiscal vulnerability. Inflationary pressures—driven by rising tariffs and commodity volatility—could dampen consumer demand and economic growth, just as the U.S. Treasury ramps up debt issuance to offset declining tax revenues. This dynamic raises concerns about long-term fiscal sustainability and the potential for higher interest rates to attract buyers for an expanding debt load.
The Uncertainty of Most Recession Forecasts
Regrettably, recession forecasts are notoriously unreliable due to the complexity of economic systems and the unpredictability of external shocks. While economists rely on models and indicators like inverted yield curves, GDP and unemployment, these often lag behind real-time developments, are subject to revisions and can broadly vary. By examples, the Cleveland Fed estimates a 26% chance of recession, the New York Fed 29%, Signal Matter Storm Tracker 28%, Wall Street Journal economists 33%, Bloomberg contributors 35%, Signals Matter’s Recession Heatmap 43% and Forbes, a 65–80% chance of recession by year-end.
Timing is Everything
Our Signals Matter subscribers often ask, “So, what should we do?” While some investors attempt to time the market, consistently doing so is notoriously difficult—even for professionals. Historical patterns show that markets often defy expectations. For example, in April 2025, stocks plunged on tariff fears, only to rebound sharply as trade deals materialized and investor sentiment shifted. Seasonal trends can offer clues (August tends to be volatile, while September historically delivers the worst returns). While market timing strategies often fall short due to unpredictable macro events, psychological biases, and liquidity traps, there are a myriad of signals worth tracking, by examples, the U.S. yield curve and Relative Rotation Graphs®.
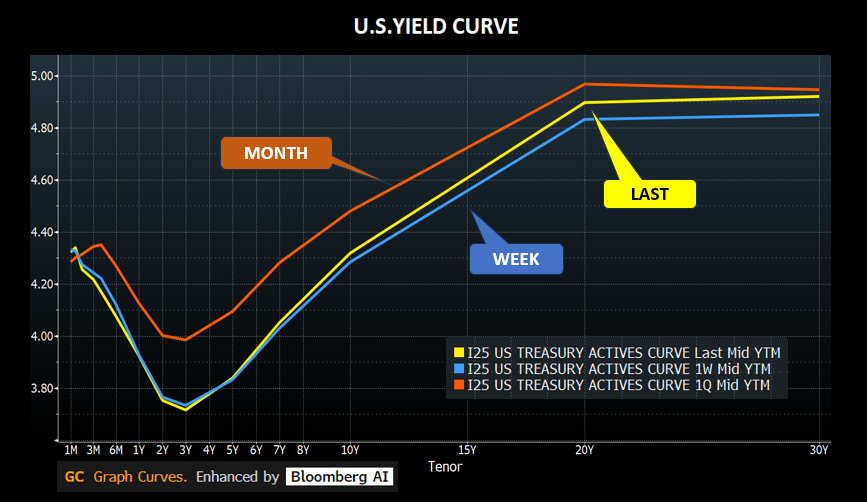
Yield Curve Signals Caution
Inverted U.S. yield curves—where short-term Treasury rates exceed long-term ones—remains a classic warning of potential recession. As of late August 2025, this inversion persists, reflecting investor concerns about slowing growth. Indeed, an inverted yield curve has preceded every U.S. recession since the 1960s, typically 6-18 months ahead. Having said, not every inversion leads to a recession, as in 1966 and 1998. Fast forward, the current yield curve inversion is mild, signaling that recession probabilities are elevated but not extreme.
For a clearer picture, we turn to RRG® graphs to visualize the relative strength and momentum of ETFs.
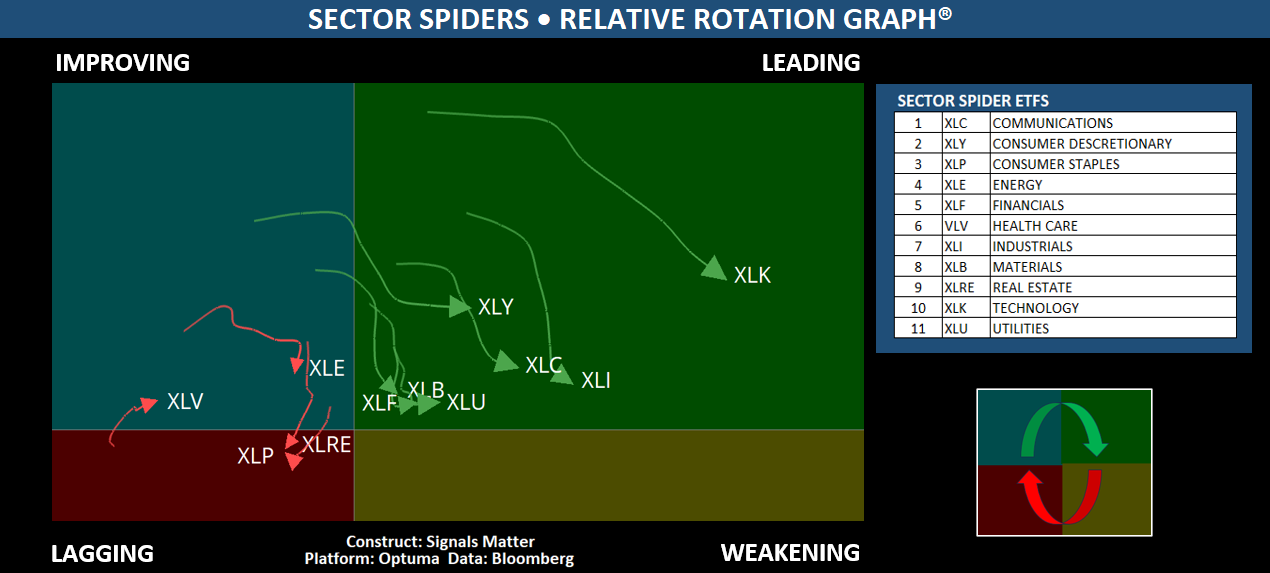
Evaluating Long-Side Sector ETFs
Long-side sector ETFs are exchange-traded funds that concentrate on specific industries or segments of the economy—such as technology, healthcare, energy, or financials. Rather than investing across the entire market, these funds offer targeted exposure to a curated basket of stocks within a single sector. Popular examples include XLK (technology), XLE (energy), and XLV (healthcare). Investors often use ETFs for tactical positioning, diversification, or to reflect views on macroeconomic cycles. Recent chart analysis suggests that many long-side SPDR sector ETFs are showing signs of weakness—either transitioning from the leading quadrant to the weakening quadrant (as indicated by green arrows), or outright failing (red arrows). These trends are signaling potential trouble for long-only investors.
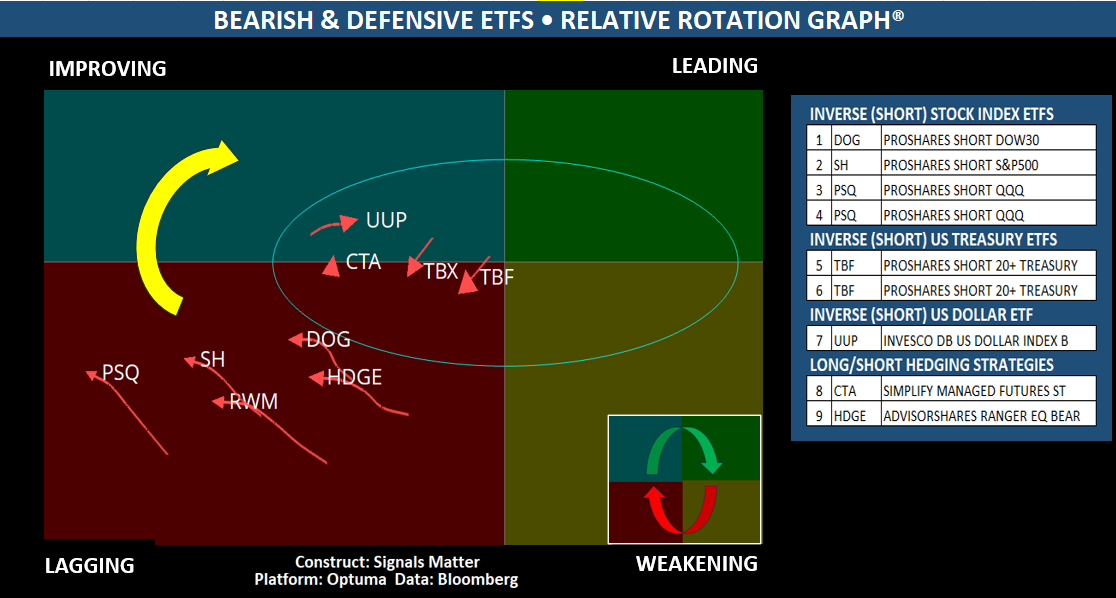
Bearish and Defensive ETFs
Bearish and defensive ETFs are designed to profit from market declines or hedge against economic risks. DOG, SH, PSQ, and RWM are inverse equity ETFs that short the Dow, S&P 500, Nasdaq-100, and Russell 2000 respectively. TBX and TBF offer inverse exposure to U.S. Treasury bonds, betting against rising bond prices. UUP tracks the U.S. dollar, often used as a hedge in volatile markets. CTA is a managed futures ETF that seeks returns from commodities, currencies, and rates. HDGE is an actively managed ETF that shorts individual stocks with weak fundamentals. These hedges, especially short-side ETFs, have been steadily moving from weakening to lagging and are expected to improve as equities decline. In other words, bets to the short side are gaining traction.
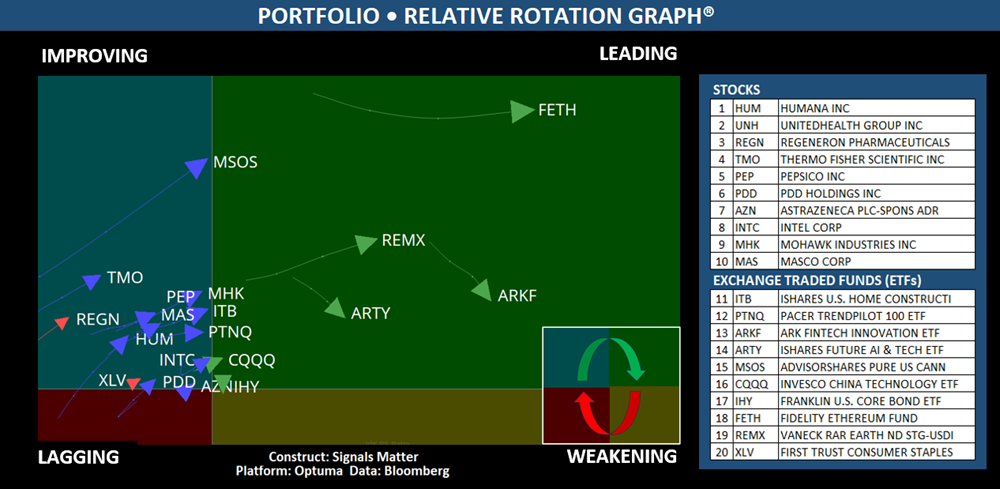
All-Weather Portfolios with Strategic Balance
At Signals Matter, we highly favor spreading investments across stocks and ETFs that are migrating from weakness to strength, or more narrowly, from the lagging to improving & leading quadrants. Stocks provide upside opportunity, while ETFs offer stability through broad asset exposure. Guided by Relative Rotation Graphs® (RRGs), this hybrid approach identifies sector trends and optimizes portfolio rotation as market dynamics shift. Daily updates to stock and ETF recommendations—released after market hours on our website—ensure our subscribers are prepared before the next trading day begins.
Summing Up
Signals Matter Portfolios are actively managed, all-weather investment strategies designed to perform in both rising and falling markets. Unbound by traditional benchmarks like the S&P 500, we maintain a balanced 50/50 allocation between individual stocks and diversified ETFs—combining growth potential with volatility control. Accredited investors—whether Signals Matter subscribers or not—are invited to streamline their investment strategy by allocating funds to the Signals Matter Partners Fund, which began trading the platform’s published stocks and ETFs in mid-June. Early performance has been strong, with returns averaging approximately 5% per month, or 60% annualized, though it’s important to note that past performance does not guarantee future results.
Insights & Access
Signals Matter Market Reports offer long-term macroeconomic insights and are available free of charge when published at www.SignalsMatter.com, on LinkedIn, and delivered directly to your inbox by Signing Up Here. In contrast, our Portfolio Solutions focus on shorter-term strategies and may differ from these broader views. Actively managed portfolios are accessible to subscribers who Join Here, as well as to accredited investors through direct investment in Signals Matter Partners, LP. For more details, explore Direct Invest or Book a Meeting with us.