Below we unpack the concept of a “black swan” and what this means for markets heading into autumn.
29 shares
By Sunday morning last, the smoke rising from drone attacks on Aramco’s oil production facilities in Saudi Arabia could be seen from outer space.
Rising energy costs from this singular event (which significantly reduced global oil production), when combined with a myriad of risks (declining GDP, earnings, growth, yield curves, etc.), are dangerous combinations that can lead to money-burning consequences for ill-prepared investors.
Let me explain why…
Black Smoke and a Black Swan Rising
You may have heard the term “black swan” being thrown around in light of recent events in Saudi Arabia – if you’re not sure what it means, a black swan is an unpredictable event that can appear from nowhere, violate the norm, and often trigger severe consequences.
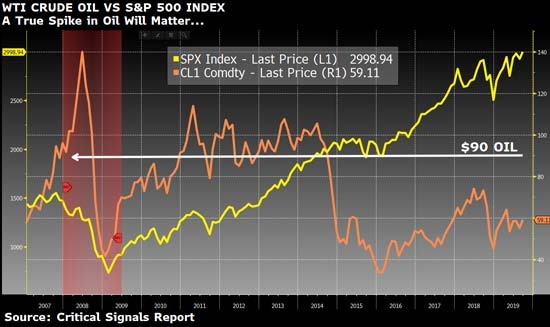
The weekend’s surprise attack on Saudi Arabia is precisely the kind of black swan event that concerns us as recession beckons, especially if the recent spike (19%) in oil prices continues.
Back in 2009, the oil spike mattered a lot, at just $90/barrel. Oil is in fact in a long-term uptrend from early 2016. Let’s not forget that. Higher prices, whether triggered by the fear of war or the greed of producers, will matter this time around, too. Markets are just too fragile.
As for just how quickly this dramatic reduction in oil production can be “repaired” remains to be seen, as much will now hinge upon the timing of “normalization.”
If days of depressed oil production turn into weeks or even months, the fires begun in Saudi Arabia could have a severe impact on global and U.S. markets, which had hitherto been enjoying new highs on the prospects of further Fed “accommodation” and media-spin promoting a hoped-for resolution of the ongoing trade war.
Unfortunately, wise investors focused on risk management can’t invest on hope alone. In fact, the sudden (and potentially escalating) military events in Saudi Arabia, as well as the ongoing trade tensions with China, speak far more about further market uncertainty (and hence risk) than they do about hope.
Uncertainty makes investing both difficult and risky, particularly in the backdrop of a global economy surviving almost exclusively on central bank support with extraordinary debt levels, inverted yield curves, and fast-declining GDP figures from D.C. to Singapore in the background.
And Yet the Bulls Continue to Trade on Hope
For now, however, the bullish spin (and hope) is all too familiar and all too in motion. We can’t ignore the power of such hope nor the power of the Fed to keep it alive despite so many tanking economic indicators all around us.
First, we have globally dovish central banks cramming rates to the floor, and in the case of the ECB, back to the printing presses for more and more QE (magic money) to keep markets rising past natural expiration dates as PE (price-to-earnings) multiples skyrocket against declining profits and earnings data here and abroad.
If the Fed starts printing again in the fall, expect new market highs by year end. It’s just that simple—and pathetic.
Germany’s DAX has seen three weeks of consecutive rallies on the back of ECB “support,” and the S&P recently hit its magical 3,020 level on hopes of further rate cuts, expected this week by the U.S. Fed.
Such hope is sending more and more investors out of record-breaking and historically overbought bonds back into record and over-bought stocks, thus fanning the flames of increasing equity highs, and thus equity risks.
The sudden reversal in the bond market was also particularly good news for small-cap and financial stocks (i.e. banks), all of which have seen recent rallies.
Secondly, we’ve seen bullish compression on the VIX (or “fear indicator”), suggesting more tailwinds for the bullish memes and hence rising markets in the near-term.
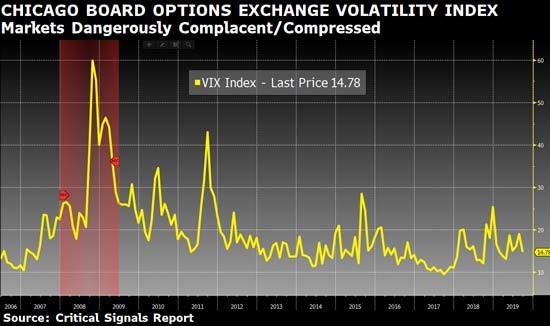
Unfortunately, the bulls need to be reminded that a compressed VIX typically foreshadows a “springing” VIX and thus higher market volatility down the road, as the falling VIX data confirms a 2019 pattern of higher lows, rather than fearless lows.
Despite first impressions, this is, in fact, a bearish rather than bullish sign.
In other words, our current bull market is more nervous than raging. If conditions in Saudi Arabia or the trade war devolve from hope to increased uncertainty and fear, markets (as well as central banks) here and abroad are far too weak to sustain the further shocks that would ensue.
That said, expect our Fed to go crazy and continue postponing the inevitable by printing more fiat money out of nowhere—it’s what they do best: counterfeit.
On a purely technical level, we saw a similar and misleadingly “bullish” pattern of rising markets and falling VIX data just prior to the market sell-off in Q4 2018. Hmm…
Thirdly, hope continues to spring eternal with regard to trade optimism, as the media bubbleheads continue to promote trade deal headlines. This, too, has led to numerous bull rallies for 2019.
But what many investors, including the bulls, continue to forget is that such headlines (and subsequent market rallies) have been in play now for over a year and a half despite the fact that no actual trade deal has ever been reached. Even the NAFTA deal has yet to be signed into law. Instead, tensions (and tariffs) have only risen during this period.
The ironies do abound…
The simple fact is that China and the U.S. have come no closer to agreeing on the “big issues.” After over eighteen months of trade wars, no signs of a resolution have appeared on the horizon. We don’t expect any resolution this year.
Instead, we’ve merely seen, and will continue to see, more optics on “interim negotiations” which will in no way encourage major companies to re-invest in such a backdrop.
Hope vs. Reality as History Repeats Itself
This disconnect between headline-driven rather than substance-driven rallies is an ominous rather than bullish indicator, as it confirms markets are relying more on hope rather than facts.
Facts are stubborn things, and in a rigged to fail backdrop of desperate central bankers pushing down rates as debt levels and markets soar, the technical as well as historical setup for a massive sell-off in the coming months is all too real yet all to likely to spur a rally rather than a fall. Still, a black swan is always a risk as well. Failing that, we need to be cautious of Fed action, which is the real wind behind current markets.
In fact, in September of 2007, on the eve of the Great Recession, the Fed was cutting rates by 50 basis points, which led directly to bullish rallies for three weeks into October, which then devolved into a trend toward the worst market crash since the Great Depression.
We are seeing similar technical as well as historical confirmations for a genuine “uh oh” moment this October or sooner, failing a miracle trade resolution or sudden “peace deal” in the Middle East, each of which, sadly, seems highly unlikely. More likely, however, is more Fed money printing when our bonds suffer a set-back.
As last Monday’s update on declining global GDP data illustrated, and as this Friday’s column on the timing of the next recession will further confirm, global conditions today are far worse than they were on the eve of the Great Recession. Ironically, however, such bad news often just means good news–i.e. Fed “stimulus.”
At a now staggering 144% of GDP, U.S. market caps are at extremely dangerous highs, which means as markets continue to rally (temporarily) even higher on more Fed “accommodation” and media spin, the risks for (and signs of) a spectacular fall from grace are now undeniably high as well.
As of this writing, we are expecting a rate cut by tomorrow (Wednesday) and will be watching carefully for the market’s reaction.
Such signs have us concerned. Black swans like the Saudi Arabian drone black swan, traceable factors like a world awash in debt ($250 trillion), supported only by central banks slowly running out of ammunition (rates below zero?), together bode for a very troubled autumn.
As always, stay informed and stay prepared, as we do each and every day on your behalf.
Sincerely,
Matt Piepenburg
Comments
4 responses to “The Saudi Arabia Black Swan: What It Means for this Fall’s Markets”
- Gene Chevrettesays:
Great commentary on today’s financial status and good insight of future possibilities.
Kudos to you for a great report
- Darrell Coylesays:
A well thought out, common sense approach to the current situation. Can you say irrational exuberance!
- Leroy Milam says:
How come when the cost of a barrel of oil goes down, it takes 2 to 3 months for the cost to reflect that at the pump. But when there is a problem with the production and it goes up , the price goes up in 1 or 2 days or less?
The gas at the pump today came out of the ground a few months ago at a lower price should reflect the cost at that time and should stay at that price until the more expensive gas , pumped out today should go up in a month or two when it gets to the pump. I do understand the supply and demand but it seems that there is gouging when something goes wrong in the supply side.
- Byron Backsays:
My question is exactly the same as the one Leroy Milam asked on 9/18/19 at 1:32pm. There is definitely some gouging going on when they have a supply problem. I would like to know how they get away with it? There should be regulations in place to curve the amount of time they have to raise or lower the prices. Shouldn’t be lopsided.