
Below, we look at the TRUMP DOW and employment numbers and place them in a context of data rather than diatribe.
Numbers vs Political Buzz
Today I want to talk numbers and politics, but in a non-partisan kind of way. With the recent release of “Fire and Fury,” our President is currently under enormous scrutiny. Whether you think he fully deserves it, or whether you think he’s the victim of a political/media witch-hunt, there are strong opinions at both extremes, and I’m not going to endorse either.
What I want to do is step out of the “fire and fury” of the MSM and blogsphere and stick to something a bit more objective: the numbers.
After all, SignalsMatter.com is about smart trading, which means we need to consider all factors—including politics—with some measure of clinical objectivity, bear or bull, left, right or center.
Objectivity is hard if one begins with an opinion rather than facts, and as market watchers, we begin with numbers not notions. So, let’s look at the numbers and consider the “Trump Bump,” the employment figures, and the DOW as a yardstick of reality and see what the data says, not the media tea-leaves.
First, let’s also keep in mind there is a critical difference between talking about the economy and talking about the markets. Main Street is not Wall Street.
Trump, for example, has tweeted more than once about taking personal credit for the DOW’s climb from 18,589 in November to over 25,000 today. He has also repeated the agenda, well-intended, of “jobs, jobs, jobs.”
Job Growth—Down, not Up
As for jobs, the recent numbers for non-farm payrolls for the first 11 months of Trump America were a bit of a bummer, but the fact remains we’ve seen steady payroll growth. Below we can see what the average growth rate has been in past years/administrations:
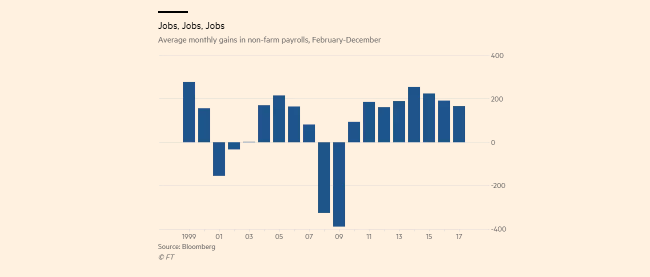
In fact, job growth is tapering off, not ripping up. As we can see, Trump is trailing Obama’s second term. But let’s be clear, I’m not saying one President is better than the other based on this, in fact, I’d contend that neither was right or wrong, as these numbers have much less to do with the White House and who’s in the oval office as they have to do with cycles and distorted labor participation data.
The real question today is why is job-growth being celebrated at all? It’s simply, well, not growing… And as for this “strong” job trend, it has been in force for many years, not since Trump took office.
The DOW as a Yardstick?
Then of course, there’s the big fat DOW. As we all know, Trump is comparing the size of “his” DOW to prior DOW administrations.
There are a number of problems when using the DOW out of context, in context, or as a political measuring stick at all. In fact, there are a number of problems with the DOW itself…
Again, without taking a red or blue stance, let’s just compare the DOW’s price action and growth under Trump’s first 11 months and the last President’s first 11 months:
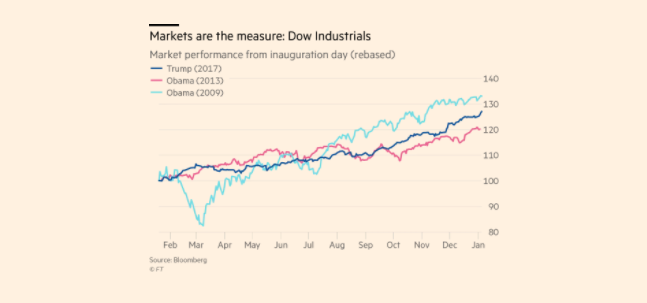
As a pure “presidential measuring tool” Obama’s first term DOW growth is actually bigger than Trump’s. This, again, is not a political jibe, it’s just the numbers. Period. In short, the tweets and MSFM media buzz are only that: buzz.
More importantly, perhaps, is the fact that the DOW itself is a profoundly flawed index (see blow), which most veteran investors and traders refuse to use, favoring instead the S&P 500. By the way, the S&P’s growth under Obama’s 1st 11 months was significantly “bigger” than Trump’s.
Comparing Market Growth—the S&P: Just the Numbers, not the Hype
Keith Fray of the Financial Times in fact took this S&P yard stick all the way back to the Reagan era. As we see below, the current administration’s much hailed market numbers trail Obama 1 &2, Clinton 2, Reagan 2, and GHW Bush.
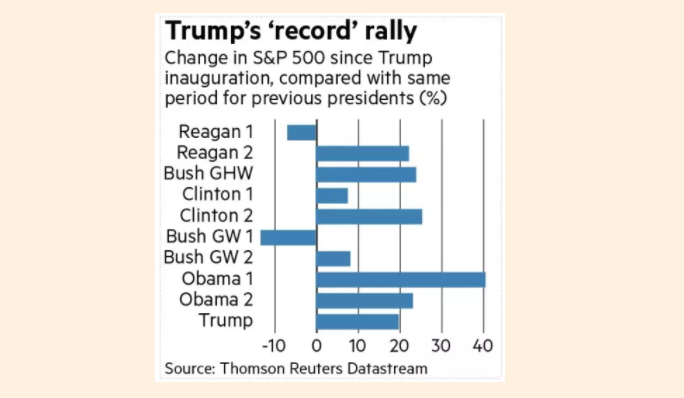
Is this meant to say Trump and his Trump Bump are bad? No. It’s just to say that the MSFM and the media buzz, when tested against history and data is again, just buzz, not news.
But if we look a bit deeper into the very nature of the DOW itself, we see how the DOW and the S&P can give very different thermometer readings.
As I wrote about in the context of inflation, employment, the BLS (Bureau of Labor & Statistics) and even X-Items earnings, a clever accountant, bureaucrat and mis-weighted index can literally make a donkey look like a Derby winner.
Illusion—even lies—abound.
DOW Distortions
Just consider the DOW. In the last year, we’ve seen two household-name giants rise to the sublime and fall to the ridiculous. Boeing has doubled in price, with an $85B dollar market cap gain, while GE has tanked by more than 40% in the same time period. But the DOW uses a clever scale to weigh Boeing at over 1000 points and GE at less than 100. If you were to correctly adjust the DOW’s overweighting of BOEING, then Trump’s much tweeted DOW numbers slide even further.
As I mentioned in my article on the BLS, if you create a “fat-camp” scale which ignores/excludes the caloric data of Pizza, fries and beer, everyone looks good—on paper… The DOW, like the BLS inflation numbers, are no different, and no less misleading as market indicators…
It’s Not Really About Who Is in the White House
But the real question here is not measuring market indexes against presidential prowess. The fact is, timing, starting price valuation, central bank influence and cycles have far more to do with the markets and economy than the man in the oval office.
Whether the market under Trump’s first full term grows faster than under Obama’s first term is largely irrelevant. Moreover, it is unlikely that it will—and not because Trump’s IQ is bigger or smaller than touted, but because Obama inherited a cheap equities market whereas Trump walked into a grossly over-valued one.
As I’ve written elsewhere, the salient issue today is the dangerous credit expansion that Trump inherited and is continuing to fatten. Neither Trump nor Papa Smurf can reverse the laws of credit gravity.
Bullish Note of Concern
On a bullish note (yes, even from me), the US economy is on a fairly good cruise control for now. The latest DOW landmark creates hope, excitement and “animal spirits.”
What concerns us here at Signals Matter, however, is that these “animal spirits” can morph into an animalistic euphoria (or “irrational exuberance”).
This “exuberance” is a telltale indicator of a market “melt-up” (as now) which more than often precedes a melt-down, which is cyclically inevitable, yet much delayed by the extreme amount of market cocaine the Fed has injected into a now liquidity-addicted Wall Street.
The drug pusher at the Fed, however, is running out of monetary narcotics. The de-tox period lies ahead for these markets as QT replaces QE while interest rates and yields edge up.
Trump would be wise to tone down rather than cheer on more euphoria, as he is not helping his cause by making a market bubble even more bubbly. Truth is, whenever and however this market corrects and pops, he’ll be unfairly blamed for that.
Like Bush in 01, Trump will have had nothing to do with next crash—which was set in motion years ago by the promiscuous monetary policy of our unofficial “fourth branch” of government—the all-too-dangerous Federal Reserve.
In the interim, our Trend Watch and Recession Watch tools will keep our subscribers ahead of the curve, be it more of the up-trending same, or warning of an historical reversal.