Below we look at cash allocation recommendations driven by our proprietary Storm Tracker tool.
23 shares
This week my daughter and I are visiting Seattle, Washington, where we’ve enjoyed the remarkable natural beauty of the mountains, the rivers, and the mighty Pacific.
But if you are familiar with the Pacific Northwest, then you’ll know as well that the weather here can turn on a dime, much like the markets.
The sun in Seattle is at constant odds with the rain clouds, just like market bulls are increasingly at constant odds with market bears.
The locals here know it’s smart to have both sunscreen and an umbrella, and they know when and how to use them.
Here at Signals Matter, we feel the same way about the markets: The weather can change dramatically, which means your cash allocation should as well.
Thus, we need to not only track markets, but also decide how to trade them either with a bullish sunscreen or a bearish umbrella–i.e. a higher cash allocation.
Get prepared and be confident in your portfolio regardless of market rain or market shine.
There’s Always Something You Can Do… And Now Even Better
A lot is going on out there folks.
And you have so many good questions for so many current dilemmas that I’ve sought to address as many of these as possible in our reports, current and pending.
As your comments have poured in from my most recent four-part series from the melt-up scenario to the meltdown scenario, many of you share one major dilemma.
You know the markets are dangerously over-valued and supported by an increasingly “mythical” Fed, yet you are unsure what to do in such a surreal market backdrop.
Recently, one reader wrote me saying that they’re almost totally out of the market being willing to miss the melt-up, so the portfolio doesn’t meltdown.
However, this strategy earns next to zero on his cash, and these scenarios including the Fed’s “great experiment” could last potentially for years ahead.
And that’s where we come in. We believe in signaling the most balanced cash allocation, so that you can participate in this year’s melt-up, yet be ready for the risks as well.
In the Signals Matter 4-part melt-up series, we described the macro conditions that could trigger a melt-up or meltdown, even a deterioration to a Japan-style stagnation.
Additionally more specific solutions ranging from increasing cash and hedging, to shorting stocks, buying put options, inversing ETFs, and more simply make sense.
In response, readers are reaching out to know where we are now in this cycle, right now, and what to do.
So, let’s look at this together, addressing your questions in the context of what’s coming soon in at Signals Matter.
Introducing the Signals Matter Storm Tracker and Cash Allocation Tool
Investing is all about knowing where the markets are going, not where they’ve been.
By tracking leading indicators, investors can do just that: project ahead and invest accordingly.
This does not require market timing or psychic power – just critically good signals.
That’s why my colleague and I built Storm Tracker, a proprietary tool that our paid subscribers enjoy at Signals Matter.
Our Storm Tracker essentially measures the distance to “landfall” for the next recession, something we absolutely need to add to our calculations when it comes to shaping investment portfolios and making a smart cash allocation.
Storm Tracker monitors in real time nearly 100 market-leading indicators or what we call market “weather patterns.”
These patterns tally such diverse “wind conditions” as consensus recession data, yield-curve inversions, uncommon trend-tracking criteria, and much more across global stocks, bonds, currencies, and commodities.
Storm Tracker is an early warning market weather radar that you’ll only find here at Signals Matter.
It’s extremely complex to derive, but extremely simple to understand as it’s rendered into a single number!
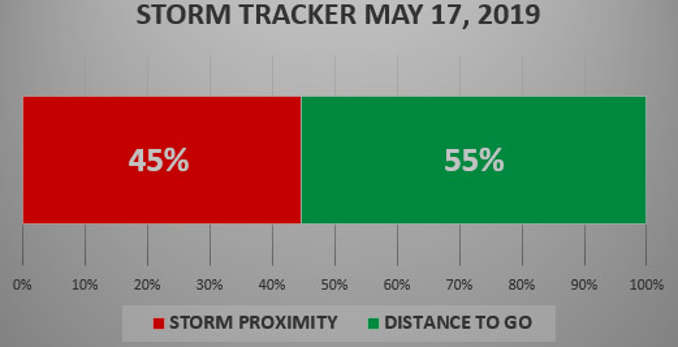
Here’s a peak behind the curtain… this mid-May, for example, Storm Tracker (at 45% in the red) is telling us that there’s a pretty big storm brewing off our bow and coming for us at 45 knots–most likely to hit landfall in the fall.
Why? Because market risks are mounting and it’s evident across the board, as we’ve shown elsewhere.
Global GDP forecasts are waning, consensus recession probabilities are rising, yield curves are inverting or going increasingly negative, trends are weakening, leading indicators deteriorating … you get the picture.
That’s just a sample of what Storm Tracker is tracking now.
And at 45 knots of strength (out of a hurricane-peak-danger speed of 100 knots) that’s a pretty high number right now.
Make Risks Work in Your Favor
Storm Tracker tells you when it’s time to head for a storm shelter by raising a cash allocation of one percentage point for every “knot” of recession-wind-speed blowing toward the shore of your portfolio.
For example, if recessionary windspeeds are at 45 knots, then your cash allocation should be 45%.
It’s that simple.
By assessing this storm and making an appropriate cash allocation, we accomplish a primary and initial component of any top-tier portfolio system, namely: Risk Management.
By the way, after decades of working in the markets, I’ve learned that risk management is the one thing most investors fail to do, which is why most investors get slaughtered in the long run.
Once risk is properly addressed via an informed cash allocation, we then turn to the next step of allocating remainder monies to or away from stocks and bonds, depending on whether we are in a melt-up or meltdown scenario, and into alternative investment solutions in both cases – something we’ll be discussing in the weeks and months ahead.
In short, the first step of our Storm Tracker is about assessing and managing risk via a sensible cash allocation; the second step is about successfully investing during periods of such increased risk.
But knowing how to spot the storm is just half of it.
Stay tuned, because in future reports, I’ll show you exactly how to do that.
In the interim, stay safe and be profitable out there in the storm.
Comments
6 responses to “The One Thing You Need to Watch to Protect Your Money”
- Nancy schulsonsays:
May 21, 2019 at 9:22 PM
What do you buy to cover the market if it goes down?
- Gary E. Gnaucksays:
May 22, 2019 at 1:02 PM
I am new to Storm Traker, but not new to the market. There are way to many world wide factors affecting all markets. I am retired and don’t want to spend full time on my computer tracking all sorts of key indicators.
What services do you folks provide and what is the cost,
sincerely
Gary E. Gnauck
- rober tyangsays:
May 22, 2019 at 1:25 PM
I like it.
- Bobby Davissays:
May 27, 2019 at 8:59 PM
Very interesting – have you guys back tested the system, for example, if the storm tracker reads 45% (OR WHEN IT REACHES x % of the time) the market(SP500) went down Y %. ) (or at 45% the market still went up 5% – 80% of the time but only down a max of 10% -20 % of the time etc.) In this way weak or false signal could be measured and would allow continued caution but not total withdrawal etc.
- Kay Kiefelsays:
September 9, 2019 at 9:22 PM
Very informative. I have a question. Where should I put my cash?.
In a cd or other savings account.