Below we look at the critical importance of “the macros” and identifying the winning market sectors.
41 shares
Last week the Dow, S&P 500, and NASDAQ all rose to new and record-breaking highs. I wasn’t kidding in October when I announced the coming of a full-on melt-up in the wake of the Fed’s sudden “easing” and all the “accommodative” tailwinds it brings.
We’re certainly seeing a melt-up…
The Fun and the Concern
The main stream media, as usual, has missed the real forces behind this latest surge and is relying upon its re-heated “old-reliable” explanations to put a rational spin on an irrational market high, namely attributing it to “improving earnings” and “retail sales,” neither of which are in fact improving at all.
I sometimes wonder if the media just pulls these taglines out of a hat whenever needed to explain away an otherwise extraordinary market bubble…
But as many of you might be saying: “Matt, who cares if this bubble is rational or irrational? All that matters is that we are making money!”
I get this. Truly.
And we are making money too, and told you to take on more risk since October, dialing our cash recommendation from the mid 40% range (summer) to the low 30% range (autumn) and pushing equities and tech sectors.
The returns have been good to say the least.
Yet throughout this bull run, we’ve also shared grave concerns and have been equally blunt about the underlying debt risks, dollar illiquidity and dangerous investor complacency.
These concerns have not lessened. Despite the fun we are having on the ground level (i.e. in stocks), the storm clouds at the 30,000-foot level remain ominous.
This “30,000 foot-level” zone is what the fancy lads call “macroeconomics,” or the “macros” and they are very, very important.
In essence, the “macros” look at the big picture stuff-i.e. such things as global and national debt levels, productivity, interest rates etc. The macros have nothing to do with Elon Musk’s latest face shot or the earnings which Apple reports.
Do the Macros Matter?
As for me, I am a firm believer that the macros matter.
As a former hedge fund manager and later family office director, every decision made before trading or allocating involved looking at the “big-picture” macros first, then allocations/investments second.
Some of you may disagree.
You may be exceptional stock pickers or trend followers, perhaps you’ve even struck gold on a couple good names that have made double or even triple digit returns, especially in the last three months.
In short, you can make a strong/valid case that stock picking (and occasional stop-loss tracking) is the key to market wealth.
I certainly agree that picking stocks is an extremely important skill.
But picking stocks without understanding macros is a lot like picking dessert items off the Titanic’s First-Class Dining menu while ignoring the iceberg off the bow. The first bites are wonderful, the drowning part less so…
In short, one has to first understand the larger backdrop in which one is making portfolio allocations or individual stock picks.
Looking at the Percentages: What Really Drives Stock Prices
- Market Direction
One thing known among most stuffy hedge fund folks is this: 50% of a stock’s price movement (up or down) is based on market forces not the management, balance sheet or health/weakness of the stock itself.
This means it’s critical to track the market’s direction before anything else, as all ships rise and fall on the same market tide, regardless of their individual characteristics.
The macros are thus significant, as they help track that market direction-the key force behind price movements.
- Market Sectors
The second most powerful determinant of a stock’s price move is the strength (or weakness) of the market sectors in which it operates (i.e. energy, tech, consumer staples, real estate etc.).
In fact, the direction of market sectors accounts for 30% of an individual stock’s price.
That’s why we track market sectors using Sector Strength and Rotation indicators, which lately has been crowded in our Leading Market Sectors, Quad 2, with the tech sector leading the way.
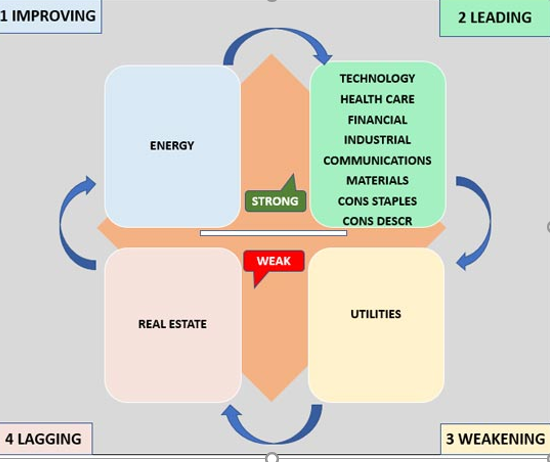
But what follows Quad 2 is Quad 3 (our Weakening Market Sectors), then Quad 4 (our Lagging Market Sectors), which means it’s critical to know how to track and measure market sectors for strength when making investment decisions.
It also further explains why our investment and portfolio building approach is heavily tilted toward identifying market sectors for strength and weakness.
Based on simple math, if 50% of a stock’s price is determined by market sectors’ direction and 30% is determined by market sectors’ behavior, that means that only 20% of a given stock’s price movement is based upon the underlying idiosyncrasies (management, balance sheet, innovative ideas, Capex etc.) of a given company.
In other words, starting at 30,000 feet and then drilling down from there to the market sectors and then the stocks within those market sectors, 80% of the hard work is done before even looking at an individual stock.
Macros and Market Sectors: Yep, They Matter
This then, is why the macros matter. 80% of the work in smart investing is done at the top (macros and market sectors), not the bottom (individual names).
Needless to say, the main stream media wastes most of your time spinning tales about individual stocks and the daily movements (or scandals) of their CEO’s. In short, mostly useless fluff.
Fortunately, we focus on facts and information, which we then inform/share with you.
A Real-Time Example, Real-Time Evidence
So, let’s look at our top-down approach in real time to make the point sink in. Specifically, let’s consider the NASDAQ since Q4 2019, and to make it even easier (and more credible), let’s track our own date-stamped journey through this period.
Remember in October when I tossed my fly rod to the ground, picked up my cell phone camera and shouted go long the markets and stocks in general and the NASDAQ and tech in particular?
Why so much conviction?
Simple, I was looking at the macros first to determine market direction-i.e. a massive tailwind and rising tide that had become obvious thanks to renewed money printing at the Fed.
In normal markets, such a tailwind might have come from rising earnings, a robust GDP report or a magnificent new trade agreement suggesting rising tides and happy days ahead.
But in a Twilight Zone market, none of those old school macro indicators mattered as much as the most important macro indicator of all: The Federal Reserve, which I’ve said many times, has effectively become the market…
When Powell announced a new round of money printing to bail out the bond market, this was a fat pitch macro tailwind and signal-i.e. a rising tide ahead.
Once I knew the markets would be rising, the next step was to find the best market sectors rising within it, which our proprietary sector tracking tools easily identified-and among that list of rising/outperforming market sectors, tech stood out like a flashing green light, at the top of Quad 2 in the chart above, or more technically, as highlighted below.
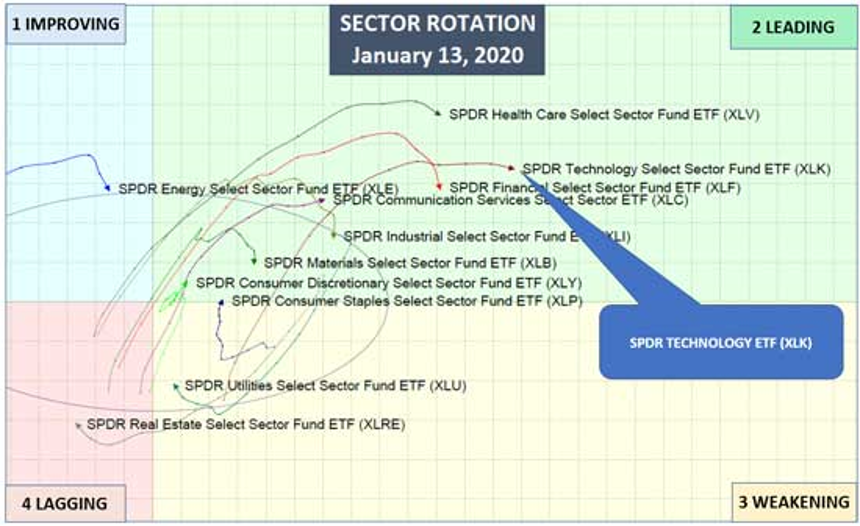
In short, by mid-October of 2019, 80% of the hard work on picking the best securities had been accomplished by simply: 1) identifying the macro forces at play (and hence market direction) and 2) tracking the best market sectors within that rising tide, in this case, the technology sector.
From there, the rest (i.e. the last 20% of the work) came down to selecting the best stocks or basket of stocks (i.e. ETF’s) within the tech sector to buy.
Summing It Up: 50-30-20
This, in a nutshell, is how our Portfolio Builder works: 1) start with the macros, 2) then identify the leading market sectors and finally 3) pick the best securities in those leading market sectors.
This may sound easier than it really is, but the 50-30-20 process is simple-the hard part is building the tracking tools to improve one’s understanding of the market’s direction (the macros) and market sectors showing the most strength.
Fortunately, we’ve spent over 50 combined years building those tracking tools for you.
Thus, for readers wondering why we spend so much time obsessing over macro forces like the Fed’s latest two-step, or other “boring” issues like inflation, yield curve behavior or interest rate spreads it’s simply because 50% of the profit or losses in your portfolio stem from getting these macro forces as right as we possibly can.
All modesty aside, we think we do this as well as anyone, if not better-and at price not limited to just hedge fund types, as current subscribers already know from our Portfolio Service.
For now, and as always, stay informed, stay on top of the macros and stay careful out there, for as recently observed, this may be a helluva market wave we’re riding right now, but there are plenty of rocks under those waves…
Sincerely,
Matt & Tom
Comments
3 responses to “80% of Your Investing Success Boils Down to This: Macros and Market Sectors”
- Nicholas McMahon Turnersays:
January 21, 2020 at 4:24 am
Keep going. I await Feb
- christopher gibsonsays:
January 21, 2020 at 7:35 am
Love your sense of humour
We are indeed dining on the Titanic , and we are indeed in the middle f the last, sweetest course ; minutes before she hits the iceberg .
Not enough life boats or lifebelts to save us from the hypothermia in Davy Jones locker
Timau
- Mindy Heathsays:
January 21, 2020 at 10:24 pm
Would you mind commenting on Unit Investment Trusts and where they would fit in with a bond and subsequent market crash in addition to lower interest rates vs. inflation? I’m seriously trying to look for safe, longer term, income investments while retaining our principal—to get us through the Twilight Zone. We are retired.
I really respect and appreciate your perspective with regard to the ‘real’ market view.