Passive ETFs are popular, effective and, as we’ll see below, a bubble as well as potential pain accelerator in the next recession.
29 shares
As we look back on 2019 and gaze toward 2020, we remain bemused by a market that is undeniably not a market, but instead the creature of the Federal Reserve.
The recent influx of $1/2 trillion into the repo markets, for example, is just more evidence of the artificial wings behind a market that rises on central bank stimulus rather than economic growth.
As for our bemused attitude, you’ve likely noted its undeniably bearish tones as to the long-term fate of these doped markets, as we’ve never doubted for one minute that a Fed-driven market is an un-natural creature destined for an inevitable fall.
Yet despite being the Frankenstein-like creation of a mad central bank, the 29% gains in the S&P this year have rightfully caused most investors to ignore the scary and complacently embrace the gains, however bogus their origins.
We too accept this new abnormal, and despite our long-term fear of the monster securities bubble conceived by the alumni of Jekyll Island, we have been openly bullish on many occasions in 2019.
After all, whenever the Fed adds more stimulus (rate cuts or printed money), we bet on the monster roaring, not falling.
The return of open (yet Fed-denied) quantitative easing in October of this year, for example, made us particularly bullish, and we hope you have enjoyed the subsequent ride up.
Fear of Missing Out… and Fear of Getting Bitten
Despite this ride, we also hope you are sticking with the cash recommendations from our Storm Tracker, as this ride up, like any ride on the back of a monster, remains riddled with risk-hence the necessity of this cash “hedge.”
Of course, some of you may rightfully be questioning the wisdom of such a “hedge,” as cash allocations do indeed cut into the upside of otherwise being “all-in.”
That is, the fear of missing out on every penny of this rise may seem overly cautious.
We get this. But the fear of missing out should be tempered by an equally rational concern for getting bitten by the very hand (monster) that feeds your portfolio.
Unfortunately, the vast majority of American investors, and hence the vast majority of American portfolios, have no such concern. Risk management tends to fall as markets hit new highs.
Is Your Portfolio About to Bite You?
What’s even more unfortunate, as well as inherently ironic, is that such fearlessness and increasingly bullish, as well as passive, portfolio positioning will ultimately become one the key drivers behind this market’s greatest fall.
Stated otherwise, the sheer size and weight of increasingly “all-in” and passive ETF-soaked portfolios will be the very straw that breaks the back of this extended bull market, a bull which may have days, months or even years of breath left in its steroid-filled lungs.
How is this so? How could U.S. investors, and hence U.S. portfolios, be one of the greatest threats to the very market that serves them?
The facts and numbers behind passive ETF’s might shock you…
The Pie Chart-Industrial Complex: Today’s Wealth Advisory Business
As of today, there are over 13,000 wealth management firms in the United States, employing over 440,000 professionals tasked with making portfolio recommendations for over 43 million individual accounts across the country.
These accounts collectively comprise over 75% of the net worth of the entire U.S.
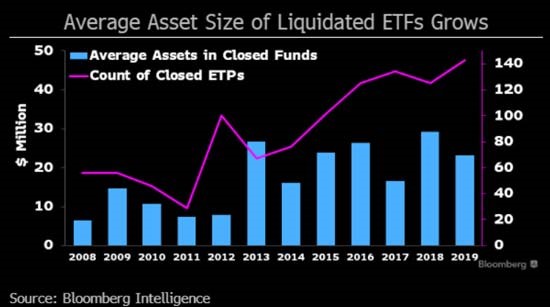
In short, the wealth management industry, one which Tom and I know quite well, is a powerful market force. Heck, at 75% of the nation’s net worth-it practically is the market, a market beginning to slide as closures begin to creep up:
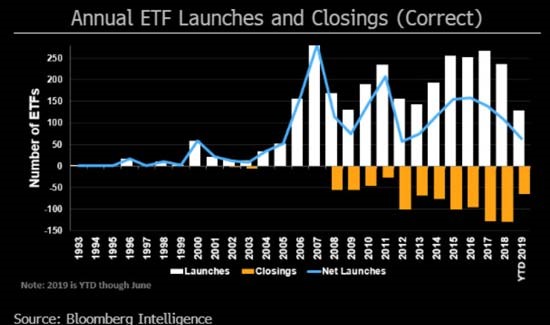
Especially among the larger passive ETFs in the $60-$80 billion range.
And here’s another little insider insight we can share with you from this “industry”: The advisors all effectively think alike, for there is professional safety in numbers and comfort in consensus feed-back loops.
That is, wealth managers (from Goldman Sachs to the local Main Street shops) pour the vast majority of their clients’ money into strikingly identical and passive ETF’s and portfolios of 60% stocks and 40% bonds, with the template ratio alternating to 70/30 or 80/20 depending on the age or risk tolerance of their clients.
We jokingly call this the “Pie Chart-Industrial Complex,” as these advisors have a powerful amount of money to manage and a powerfully similar way of steering all that money into almost identical pie chart-60/40 allocations of stocks and bonds using the same passive ETFs across the industry.
I’m sure you know what I’m talking about, as I’m sure your own advisor(s) have made similar “pies” for you in the past.
I’m also sure those same advisors are boasting of their 10-year+ track records, which have done nothing but rise on the back of a 10-year+ bull market, the greatest ever seen.
Needless to say, the fall from these nosebleed highs will be equally record-breaking, at which point those same advisors will collectively blame “unforeseen market anomalies” …
Yep. We’ve seen that movie before too.
If Everyone Is Buying the Same Pie, Its Value Rises–The Hidden Danger of Passive ETFs
Needless to say, when thousands upon thousands of advisers are simultaneously allocating trillions of dollars into the same passive ETFs, the price of the stocks and bonds within those passive ETFs rise based entirely upon the flow of funds into those vehicles rather than upon the underlying health (or sickness) of the securities which comprise them.
In short, all securities rise in the rising tide of inflows from the Pie Chart-Industrial Complex otherwise known as your every-day “wealth adviser.”
Such price action based on forced flows rather than inherent security strength is a toxin building beneath and within the securities markets, and hence, beneath and within the very portfolios currently enjoying the “good times” of a Fed-driven melt-up.
Passive Junk Bond ETFs: Yet Another Ticking Time Bomb
This hidden toxin is most obvious in the case of bonds in general and junk bonds in particular.
Traditionally, for example, the vast majority of wealth advisers will tell you that bonds are the safe-haven hedge to market risks, and hence unanimously recommend that all their clients hold large percentages (i.e. “pie slices”) of these “safe” bonds.
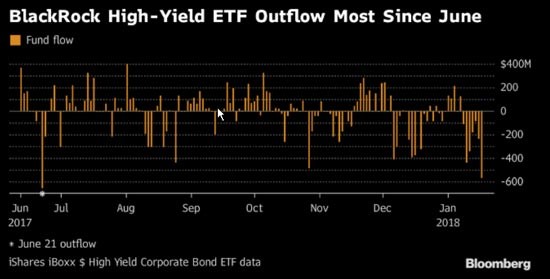
But in a world of flat to negative yields, not only are investors getting little to no return for their bonds, they are also getting grossly over-priced bonds due to the equally brave new world of massive amounts of passive inflows into bond ETFs, which forces their prices up… until those inflows start flowing out, as in Blackrock’s “High-Yield” ETF where funds have been flowing out for much of 2019.
In other words, investors are grossly overpaying-putting down Tiffany’s-like dollars for K-Mart-like credits in such passive ETF’s.
Today, almost every standard pie chart portfolio in the U.S. contains 5%-10% allocations to currently popular junk bonds, as they are the only bonds that offer even any semblance of “yield” (risk be damned, or risk be forgotten).
These bond allocations are typically found/expressed in the two most common and popular junk bond passive ETFs, namely the SPDR Bloomberg Barclays High Yield Bond ETF (NYSEArca: JNK) and the iShares iBoxx High Yield Corporate Bond ETF (NYSEArca: HYG). These passive ETFs appear to be getting toppy to us:
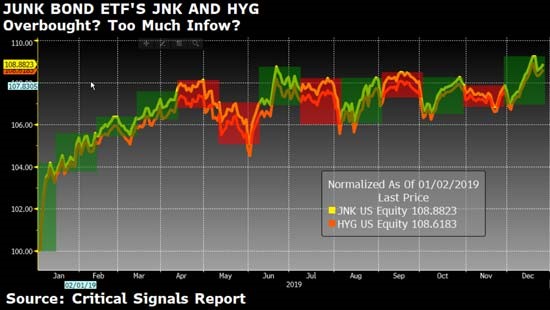
In fact, anywhere from a third to half of the all the trading done in the junk bond market is through just these two passive ETFs! Beware.
Herded Like Sheep to a Cliff
Investors/buyers are essentially being herded into these passive ETFs by their advisers’ “pie chart” formulations without doing any real research into the fundamentally crappy nature (i.e. inherent default risk) of these crappy (i.e. junky) bonds.
In fact, the price of the low-quality credits within these passive ETFs are now reaching record highs despite the fact that in normal scenarios, investors should be shorting (or selling) the heck out these junk bonds rather than piling more money into them!
But such inversions of common sense, and hence smart risk management, just get tossed out the window in a world of passive ETFs and record inflows, combined with central banks artificially supporting the prices of otherwise sickly bonds.
It’s a perfect storm, yet one almost entirely unnoticed-and likely to continue to go unnoticed for the foreseeable future.
But Now YOU Are Noticing
In fact, we’ve warned our subscribers long ago about the dangers inherent to these cancerous, massive and ongoing inflows into passive ETFs, an inflow driven by the very “Pie Chart-Industrial Complex” otherwise tasked with “steering your wealth.”
We’ve also warned our subscribers about how following such traditional, consensus-driven investment advice will ultimately get you slaughtered.
Why? Because these over-crowded passive ETFs rise like bubbles and then fall like rocks in a recession. This is especially dangerous if you are an older individual approaching retirement and the market loses more than 40% in a recession that can last for years and not recover its losses for decades.
Can you or your portfolio afford such a loss? Has your adviser even contemplated this? And is your only “hedge” against this scenario just more bond allocations? That’s like going from a frying pan into a fire…
As importantly: Can you afford to ignore managing the risks that will cause such losses?
The Frying Pan and the Fire
Take those two junk bond passive ETFs discussed above.
Can you afford to ignore the fact that the daily trading volume of these bonds is only $8 billion per day, and that most of these trade flows (about $4 billion worth) occur at the ETF level rather than at the actual, over-the-counter bond market level of the individual credits within those passive ETFs?
Stated otherwise, those junk bonds have almost no liquidity, which means the day the crap hits the fan on these crappy bonds, you won’t find a buyer for them.
Minutes into a recession, these and numerous other passive ETFs will fall like bricks in price after having risen like Fed-supported zombies for years.
Again: can you afford to ignore these basic, but entirely ignored facts by the bubble-heads otherwise known as the mainstream financial media or the Pie Chart Industrial Complex?
The Solution: Informed Portfolios Rather Than Passive Time Bombs
At Signals Matter, we are all about making you a better investor by being an informed investor.
The more facts that come before you today, the more confidence you will have in making the right decisions tomorrow, including the right decisions regarding the construction of your portfolio.
By now, you’re realizing that the old 60/40 “pie chart” variations handed down by the consensus thinkers of the Pie Chart Industrial Complex will not serve you well in a pre-recession backdrop of Fed-driven crazy and record breaking (toxic) inflows into passive ETFs–what Michael Burry of “The Big Short” now sees as the single greatest threat to the next market crash.
Going into 2020, we know there’s still a lot of confidence in these Fed-supported markets, and frankly, we too have been bullish when the Fed turns on the spigots and hands us a fat pitch.
But despite these seductive new highs, we also know that you need a new kind of portfolio to manage the risks (as well as opportunities) lurking beneath these recent new highs.
Be on the Look-Out: We Have a Solution Coming
Our simple portfolio approach captures the crazy upsides of these crazy markets while simultaneously protecting you from the risks hidden beneath these market waves-such as the junk bond passive ETFs described above.
Needless to say, the all-weather portfolio Tom and I manage for subscribers does not look at all like the passive, 60/40 Pie Charts you’ve likely seen before.
Nope. We’ve got something infinitely better.
Our solution is active rather than passive, and driven by respecting risk, rather than hiding or ignoring it. In this way, we build portfolios built for tomorrow, not yesterday.
And know this: Tomorrow’s markets are going to need a new approach-and your portfolio will too.
2019 is waning. It’s time for some New Year’s Resolutions. Here’s one: Do what informed investors do – don’t follow the herd.
We’ll back next Monday with an all new What’s Happening Now.
Sincerely,
Matt & Tom
Comments
7 responses to “Passive ETFs & “Pie Chart Portfolios”: The Hidden Rope That Will Ultimately Choke This Bull”
- Ken Pizzo Sr.says:
Thank you for the sound advice!
- Edouard d’Orangesays:
Okay, you’ve whetted our appetite. I think that equity markets, and not just junk bond markets, are quite toppy. I hold no ETFs which will be difficult to prices in a suddenly dropping market (flash crash). I’ve scaled back on lower rated bond funds, have a couple of mutual funds with higher rated corporates/bonds, have a short term treasury fund (with a pathetic yield) and a few stocks that I believe are under valued (IMO, but I could be wrong). What is your infinitely better solution?
- Anthony Short says:
Most excellent writing! Thx you and very much look forward to more of the same. ANT
- HUgh Dolansays:
Thanks for the realistic commentary.
- Marty Lawsonsays:
This was a very interesting article. I began reviewing my employer 401K portfolio options, (very limited), and even what seems like the “safest haven” investment (what I would call cash) is backed mostly by the investment firms “bonds”
So, generally, I feel like I am up a creek either way when this all comes crashing down. What does a guy like me do with a portfolio that has no real “cash only” option to place funds into. Right now I am pretty much 50/50 with my investments, but the 50% in the safe haven investment seems even more at risk now based on this latest article.
- LZsays:
Are you going to show this new portfolio in CSR ? We are looking forward to it ASAP !
- Thomas R.K.L. Garciasays:
Looking forward to Monday’s, “What’s Happening Now” solution to breaking out and away from the herd.