
These are Awkward Times
Amid a global pandemic, stocks are hitting new highs. Should we buy into this rally? Hedge it? Or short it?
We’ll get to what these awkward times mean for your portfolio and strategical choices as we head into 2021 (HINT: It’s something we’ve learned on the football field and the battlefield), but first, the awkward.
As we head into the holidays and give thanks for our awesome families (and the long-awaited vaccines), we pen this note to remind you that we are not out of the woods yet, so far as stock markets are concerned.
Greed is plentiful, too plentiful; institutions are all-in, with disturbingly low cash levels; volatility is itself volatile; we are borrowing to the hilt; the yield curve is steepening; and corporate and retail bankruptcies are surging.
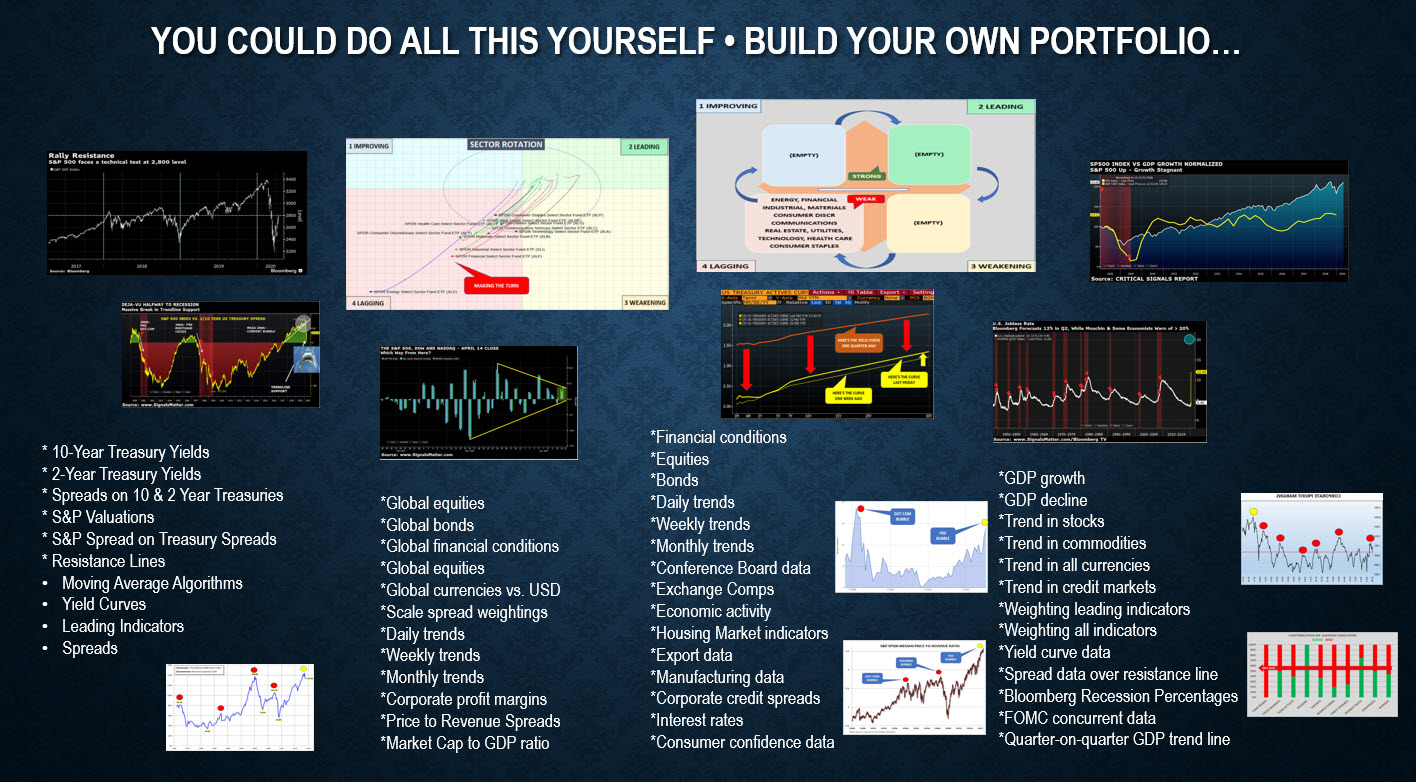
Pictures are worth a thousand words. In this pictorial note, we illustrate what’s going on behind the scenes, and close with a note on portfolio solutions.
Let’s take the awkward, one-by-one.
Fear vs. Greed
Fear vs. greed is a trackable emotion. During fearful times, investors sell. During gleeful times, as at present, they buy. Understanding investor emotions and how they play out in the markets is something we can both track and profit from.
Here’s the emotion.
The last buyer: It’s not that buyers buy until they don’t; it’s that buyers buy until they can’t, because there are no more sellers.
That happens when everyone is whole-hog in the markets, as at present. There is no more inventory of stock to buy. That takes price up.
The last seller: Conversely, it’s not that sellers sell until they don’t; it’s that sellers sell until they can’t, because there are no more buyers.
That happens when everyone is whole-hog out of the markets. A ton of stock inventory builds that nobody wants. That takes prices down.
One way to track fear vs. greed is to calculate the ratio of buying strength to selling strength, which tells us who’s in charge, the bulls or the bears, at any particular point in time.
It’s called the Fear/Greed Index and it’s an excellent oscillator for identifying trend persistence and divergence.
In the chart below we plot the S&P500 Index, along with its Fear/Greed index beneath, which displays a whole lot of fear (red) back in March of 2020, followed by a whole lot of ensuing greed (green) through August, followed by increasingly frequent bouts of fear.

You get the picture, but here’s the big picture.
As stocks have been rising through 2020, greed has been waning all this time as investors become increasingly wary of stocks, especially while in recession for most of the year (the broad red column in the upper portion of the chart, bookended with the words “Rec”).
Bottom Line on this: We appear to be heading in a fearful direction as we close out 2020.
Depleted Cash Levels
Then there is the matter of depleted cash.
Money managers that oversee some $534 billion in assets are truly drinking the cool aide. According to an early-December survey recently published by Bank of America (BofA), money managers are underweight cash for the first time since May 2013, with levels down to 4%, revealing the most bullish investing stance since February 2011.

Institutions have been drawing down their cash reserves to buy stocks to levels BofA is calling a “sell signal,” circled in red. According to BofA, historically, when investors’ cash allocation falls to 4%, the S&P declines an average of 3.2% in the following month.
To boot, BofA said that about 76% of S&P 500 components are trading above their 50-day moving averages, a level that strategists at Canaccord Genuity Group, Inc. (a leading independent, full-service financial services firm) say is in “extreme overbought” territory.
A Volatile Year
2020 has been a volatile year, filled with extreme moves, charted below, marking it one of the most volatile years for markets on record, thanks to a raging pandemic, economic uncertainty, and the U.S. presidential election.
Even this December, in the final month of 2020, the S&P 500 Index hosts 1%+ advances and declines. 2020 as a whole posted the most daily 1% swings in either direction since 2009. High volatility connotes extreme fear and greed.

A word on the VIX.
Last week, in a Subscriber-Only Daily Insight, we highlighted a recent version of the VIX (or “fear index”), namely the Chicago Board Options Exchange (CBOE) Volatility Index, noting that it had climbed above a key 2020 pivot line, marked by the yellow line in the chart below.
All of the time that the VIX price was falling (top white arrow, from early November to early December), the fear had been subsiding (bottom white arrow). This gets a little wormy but look at this as an indicator within an indicator – signaling that greedy folks like us were nosing around to buy volatility, which we timely suggested.

Borrowing Spree
No doubt about it, as we’ve discussed here and here, the US is now on a borrowing spree, from corporations to the Federal Reserve, with the Fed purchasing most of the new-Treasury bonds created this year.
The Congressional Budget Office projects our debt in public hands to be just under 100% this year (98.2%) as a share of GDP, but that is still nearly three times what it was at the beginning of the century. Next year it’s forecast to surpass the level in 1945.

Going forward, the US federal government is expected to keep borrowing as far as the eye can see, according to Bloomberg Opinion, with the deficit rising inexorably from 4% in the late 2020s to over 12% by mid-century.
The CBO’s baseline projection is for the federal debt in public hands to reach 195% of GDP by 2050, nearly twice as high as at the end of World War II.
There is no free lunch.
Unless the borrowing can create NEW productivity (it hasn’t and doesn’t) and therefore pay for itself, secular stagnation has to continue. In other words, interest rates have to stay at their present low levels, which isn’t what the US Congressional Budget Office (CBO) expects.
In its most recent long-run forecasts charted below, nominal and real interest rates rise over the course of the 2020s. Net interest payments would rise above 2% of GDP from 2030 onward and hit an unsustainable 8.1% in 2050.

Yield Curve Steepens
The Federal Reserve spoke following its mid-December meetings, strengthening its commitment to support the US economy by maintaining its massive asset purchase program pending “substantial further progress” in employment and inflation, without specifying numbers.
The stock market yawned, looking for more aggression near-term. The reality is that the artificially “recovered” US Yield Curve is the steepest it’s been in three years. And it steepened a bit more after the Fed delivered its remarks. A steepening yield curve means higher interest rates, which means lower valuations for bonds, that yesterday’s portfolio hedge.

Corporate & Retail Bankruptcies
Then there are the rising corporate and retail bankruptcies, fueling the worst 3rd quarter on record. Recent US bankruptcy filings showed that 70 companies with more than $50 million in liabilities sought bankruptcy protection last quarter, including a steady flow from the energy and retail sectors. That compares to the 76 in the prior quarter, per Bloomberg.

Retail busts are just as bad. While small-business attrition is high in normal times, the swiftness of the pandemic and huge drop in economic activity that is taking a toll, according to Yelp Inc data. More than 80,000 restaurants permanently shuttered from March 1 to July 25. Of those, about 60,000 were local businesses, or firms with fewer than five locations.

Portfolio Solutions
You get the picture. All is not good in Mainstreet America. All this borrowing and stimulating can have an unhappy ending if it is not productively spent. Handouts keep folks afloat, not make them productive.
We know. We’ve painted an ugly scenario here, not just because it could happen, but because it could affect portfolios from $100,000 to $100,000,000.
Here’s the key, as mentioned, learned on the football field and the battlefield.
A Good Offense Requires a Good Defense
Plain and simple, there are multiple portfolio solutions out there that can help in any transition from “all-in” to “all-out” of the market approaches. As greed morphs into fear, there are plenty of investments that can first hedge traditional portfolios (provide a good defense), then outright profit as markets fall.
And we’re not talking about bonds!
Take a look. In 2020, bonds did little to offset the equity plunge in March, and have done nothing but rise in synch with stocks into the end of this year, plotted below.

Bonds are no longer a protective allocation, with interest rates at zero and rising, which we discuss at length in our updated 2020 Investment Primer. The Primer goes a long way in describing why 2021 and beyond will require a good defense, a different portfolio solution than that offered by the traditional stocks and bonds, and what that defense is.
You can download our Free Investment Primer on the landing page of our website at www.SignalsMatter.com, or just click here: Download Now.

To Buy or To Sell – Always the Question
Coming full circle, should we buy or sell going into the yearend and 2021? That’s the question. Join Signals Matter now and we’ll show you exactly what we’re suggesting: Join Now.
Here are some hints. With all that we’ve shared above, this is a good time to buy and to sell – which we call hedging our bets. There are some equity sectors of the market that are flourishing (buys), but there are some all-encompassing stock indexes that are teetering at the same time, which you can short by using plain-vanilla inverse ETFs. Currencies too can provide a further hedge, along with long-volatility plays and a range of actively-managed long/short strategies.
By mixing and matching strategies like these, in smart proportions, long strategies coupled with hedge or short strategies can protect your portfolio from risk, while enabling a positive return almost all the time. That’s what we call an All-Weather Portfolio. And that what we provide Subscribers each and every day at www.SignalsMatter.com.
Don’t believe us? See what our Subscribers have to say: Signals Matter Testimonials.
Our Portfolio Service
In a nutshell, building portfolio is an artful science…
Don’t be left out. Watch our Signals. Track our Suggestions. We can help you navigate through 2021 with a defense that’s as good as an offense.
Sincerely,
Matt and Tom