Below we look at the all-important Elliot Wave and what this means for your portfolio construction.
20 shares
In my latest post, I introduced to you the Signals Matter “Storm Tracker.”
I explained how we track dozens of complex market weather patterns like the Fed’s “great experiment” to provide you with simple yet reliable market forecasting tools.
Now that you’ve seen a bit of how I track these market weather patterns, I can now show you how to not only manage market risk, but also invest in all market conditions.
Building upon Storm Tracker, we derive the Signals Matter All-Weather Portfolio, an uncomplicated, elegant allocation map which our paid subscribers see updated as markets change.
Simply, the All-Weather Portfolio displays the asset breakdowns recommended in real time so that subscribers are capturing upside while managing risk.
You get the right types of assets and position sizes, shown in percentages, that you need to adopt as market weather conditions change.
The Signals Matter All-Weather Portfolio uniquely allocates capital to cash, stocks, bonds, and liquid alternative solutions that are working during any phase of the business cycle, including recessionary cycles.
When they’re combined, the Storm Tracker and the All-Weather Portfolio will go far in answering your questions as to what to do.
And you can get all the details on what’s happening right now.
Here’s How We Breakdown Secret Market Movements
In a nutshell, what’s happening now is not pretty. Again, our paid subscribers already know that in detail, based on their own landing page data deliverables. But we’ll share a few of our findings for all of you.
The Storm Tracker’s “wind speed” has been moving up incrementally in recent weeks and months, because recession indicators are rising. Nevertheless, we expect the Fed will have to intervene and reduce rates further and more than likely start printing money again by year end.
Specifically, global yield curves are inverting or negative, trends are weakening, leading indicators are deteriorating, and a number of our proprietary indicators are starting to turn south.
What’s the cause for all of this?
It’s simple: financial markets are wrestling control from politicians.
The markets completely tanked in December 2018, and this financial downturn, along with political pressure, caused the Fed to shutdown (i.e. “pause” further rate hikes) in Q1 of 2019.
Again, we expect the Fed to start its money printers up again soon to keep this party going. Crazy…
So, who’s in control exactly?
Is it the Fed, the politicos, or the markets?
Well, I want you the investor to be in control.
But as I’ve argued in prior writings, Wall Street and the Fed can appear to be in control by distorting and misrepresenting everything from earnings and inflation to employment.
In the near-term, the Fed can also manipulate rates and print dollars. Trust me—it’s coming, because the Fed has no choice but to print money to buy unwanted US debt/bonds and thus keep yields and rates down.
Alas in the end, however, it’s the market that gets the last and final word–at least the kind we can trust with math rather than spin.
That’s why we watch the markets very carefully.
So you can be in control.
Toward that end, here’s an example of what we’re seeing right now.
So forgive me as we get a bit technical for a moment.
The Elliot Wave: Just One of Many Indicators We Track for You
Tons of technical indicators are out there, and we’ll be addressing them in subsequent reports.
But one indicator that we are watching right now is the Elliot Wave.
It’s likely you’ve never heard of it.
Simply said, the Elliot Wave is a form of technical analysis that investment veterans in charge of massive portfolios use to determine the start and finish lines of market cycles.
Elliot Waves forecast market trends by identifying market price extremes (both high and low) driven by investor psychology, which is otherwise difficult to quantify/measure.
That’s right the Elliot Wave looks to understand how investors like you think as a result of market pricing.
Many debate the empirical validity of the Elliot Wave, but when you look at the Elliot Wave along with dozens of other indicators, as we do here at Signals Matter, important weather patterns emerge.
No single indicator is overwhelmingly impactful; however, when understood and examined in conjunction with other market patterns, insights from signals like the Elliot Wave make it much easier to track market storms.
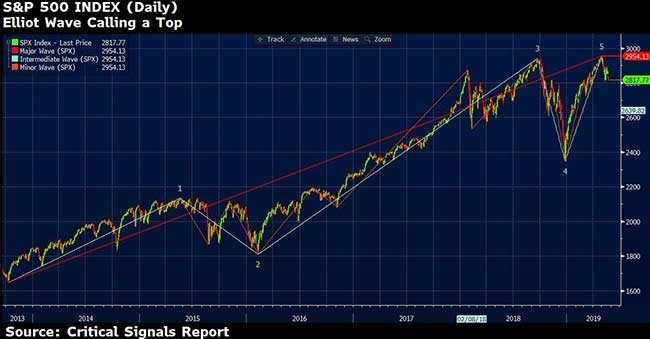
Currently, the Elliot Wave is describing a market top, not just on a daily basis, but on a weekly and monthly basis as well.
Elliot Waves run in cycles, or waves, with Wave 1 marking the beginning of a new bull market and Wave 5 signaling its peak-i.e. the period just before it tanks.
Historically, market bears are ridiculed when Wave 5 kicks in.
By this point in the Elliot Wave, investors are typically fully invested and just don’t see (or want to see) anything but more profits ahead.
They are effectively investing with beer goggles on.
These herd-thinking investors historically suffer the most, as we saw in the U.S. in 2000 and 2008 or in Japan in 1989.
Such consensus-thinking investors took a false comfort in “safety in numbers,” and thus marched toward market peaks with great confidence just before falling off the cliff together.
These Charts Will Help Clarify Things
Daily, weekly, and monthly Elliot Wave data on the S&P 500 Index are telling us that we are at a dangerous top with each time frame confirming the next. In short, expect a less than stellar summer markets and even bumpier autumn until the Fed kicks in some steroids in Q4.
Specifically, here’s the Daily Elliot Wave on the S&P 500 Index from 2013 through Thursday, May 23, 2019, 10am.
(NOTE – Stocks are slumping globally today, May 23, as we pen this article, with the Dow Jones Index falling as much as 406 points, mapping an “outside monthly reversal” as markets increasing believe the trade dispute with China will not end any time soon.)
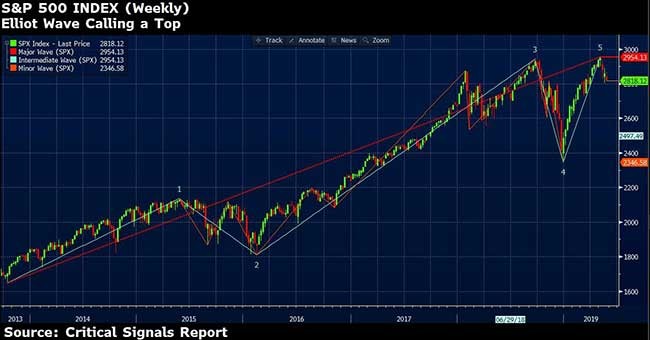
Here’s the Weekly Elliot Wave for the same time frame …
And, finally, here’s the Monthly Elliot Wave …
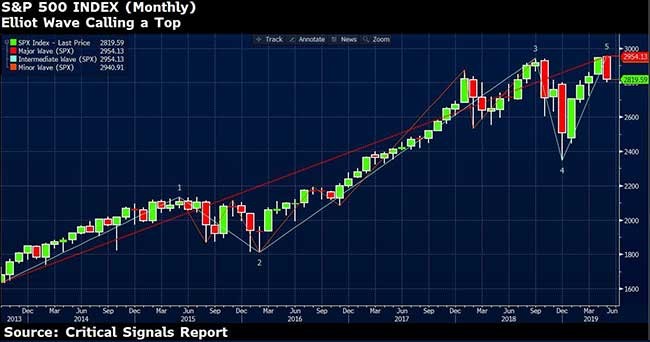
You should notice how all these Elliot Wave time periods look very similar.
And what you need to recognize is that the S&P is at an all-time high.
What You Do Next Matters for All Your Future Investing
So, let’s add things up.
The Elliot Wave (or waves) is signaling a market top. We thus expect some down turns in the late summer and fall—but this by no means a market crash, for the Fed WILL step in for as long and much as they can…
And the Signals Matter Storm Tracker, which combines this market signal with a myriad of other weather patterns, is telling us that the “wind speed” of the recession we are tracking is approaching at 45 knots.
This simply means today we are signaling an advisable cash position of 45%.
Again, it’s that easy.
The Storm Tracker is THE suggested portfolio cash allocation.
From there, our All-Weather Portfolio takes over and allocates the remainder (55% in this example) across a very specific range of equity, fixed income (i.e. bonds), and alternative investments on both the long and short side in each instance.
For Signals Matter subscribers, they already know just where and how to be positioned as these Fed-driven markets gyrate based upon central bank intervention rather than normal price action.
Currently, for that remaining 55%, the All-Weather Portfolio allocation is favoring a wide range of government-agency, municipal, and precious metal ETFs as investors seek shelter.
On the alternative investment side, with stocks falling from favor, short-side ETFs are indicated across stocks generally and specific stock sectors at various leverage points.
As we roll out the Storm Tracker in the near and exciting future, you’ll understand in real time which specific sectors and instruments are working, whether in a melt-up or a melt-down.
Just remember this takeaway, whether markets are melting up or melting down …
There’s always something to do that will make you money!
So, for now … stay tuned and keep those comments coming!
Let us know if we are heading in a direction that will help you answer all of those really great questions. We answer subscriber questions as they come in. For the rest of you, we hope these free reports are informative.
We’re here for you.
In the meantime, stay informed and be careful out there in the winds of change.
Comments
4 responses to “Protect Yourself Before Market Storm Hits”
- Jerome Lynch says:
May 24, 2019 at 1:53 AM
Looking for “Simply, the Crash Portfolio displays the asset breakdowns you’ve been asking for”.
- Franksays:
May 24, 2019 at 8:20 AM
Only one problem. As I understand Elliott Wave the move down from Oct 3 was an A-B-C. No other way to count it. It was not a 1-2-3-4-5 and that is what confusing because that down move has to be a 5 count, not a 3. However, I do agree that the market has reached a top no matter which way you count it. I can’t see it making another new high. Yesterday the NYSE stock index futures broke the low earlier this month but the S & P and Dow didn’t. Not sure where we go from here but I say another week or so down then some sort of a summer rally before the big decline this fall.
- Ben Benefieldsays:
May 24, 2019 at 11:51 AM
Thanks Matt,
I didn’t realize that the Eliot curve allow one to see the whole of the S&P. It’s an awakening for me as a retired 83 year old managing my portfolio. Keep up the good work, Ben
- Vincent Lobansays:
May 24, 2019 at 4:58 PM
Mr. Piepenburg,
You do a great job in your daily webposts, I enjoy them. I do not perceive you as a Perma Bear as some of your critics would say. I think this stock market’s days of artificially inflated, highly-elevated levels are numbered as these crack cocaine induced equity indices will come down. I look forward daily to your commentary especially how it relates to the Federal Reserve. Thank you again for sharing your wisdom and experience with us laymen!