
Below, we look at the valuations behind the leading tech stocks: Amazon, Facebook, Netflix, and Google. Avoid the tech stock cliff ahead !
The Justin Bieber of Tech: Circa 2000
Ah, the good old days. I was barely old enough to shave and hardly knew a stock from a bond when the dot.com/NASDAQ bubble of 2000 made me almost look like… a hedge fund manager.
In one year (and 2 IPO’s), our start-up fund was up nearly 400%–all due to pure luck and a rising tech sector. I was a 20-something riding what I thought was a once-in-a-lifetime wave of crazy.
In short: “that really annoying idiot.” (My bemused wife called me the “Justin Bieber of Tech.”)
But even then, long before MIT grads created the derivative trade (aka “weapons of mass destruction’) that killed the markets in 08 [and even long before the Fed poisoned the markets with a “QE gone wild” (circa 09) that will kill our markets down the road], I knew enough to know those percentages in the dot.com bubble of 2000 were, well: crazy.
Walking Away from the Absurd
So, I walked away and got out of the markets, raised a couple of beautiful, awesome little munchkins overseas, and watched the NASDAQ tank without me.
As dumb and lucky as I was in those days, I had just enough common sense to recognize what Camus famously described as “the absurd.”
And the tech bubble of 2000 was precisely that: absurd.
Today’s Tech Bubble
Fast forward to the tech bubble of 2018 and I see that same absurdity, only now it’s returning in ALL-CAPS.
Today, history is indeed rhyming and repeating itself with an almost smug élan, as the percentages (and valuations) coming out of names like Amazon, Netflix, Facebook et al make me just want to wince.
They’re ABSURD.
Amazingly, many of the charming prime brokers I trade through today weren’t even in high school during the 2000 tech bubble—and so the lessons I gained in those golden trenches aren’t even on their minds or Lacrosse-calloused fingers from recent glory days “in the crease” at Duke and Princeton…
A lot of today’s young Wall Street Turks think this time is different. They (and the millions of retail investors they sell to) think the FANG stocks are going to take them and the US markets to the Promised Land.
Frankly, I can’t wait to short those “miracle stocks” …but for that I’ll wait for the signals, not my blogs.
Until then, let’s just look at some of these tech stocks and blow the dust off that corner of our collective minds which speaks to common sense and a little bit of 5th-grade math.
Huge Market Cap…
The infamous backbone of today’s modern tech “miracle” — Facebook, Amazon, Netflix, Google, Microsoft, Apple, and NVidia–have more than doubled in value from $1.9T in 2016 to over $4T today.
Not-So-Huge Cash Flow…
But here’s the rub: During that same period of 100% market cap gain, those companies have experienced a collective gain in operating free cash flow of only 13%.
So how does one account for their sky-rocketing stock prices? Real simple: herd mentality, or as the traders call it: extreme momentum chasing.
Here Comes the Market Herds
I’ve seen herds before. Investors become cows, led by bulls, and laughing all the way toward a market cliff at 100 mph, their cow-bells chiming and wallets blissfully “moo-ing.”
This is because investors in a crowd (like cows in a herd) don’t have time for balance sheets or balanced thinking. Such details, after all, are no fun.
Accordingly, such investors are not noticing the absurdity of the current free cash flow multiples and are confident that the herd knows what it’s doing and thus they follow along, blissfully seeing profits yet clueless as to risks.
Taken together, the above seven companies are currently trading at 31X free cash flow. And if you remove Apple from the equation, the rest of the group trades at 41X free cash flow.
Holy Cow…
Getting Free of the Crowd: Balance Sheets vs Momentum
For subscribers of Signals Matter, I talk a lot about Free Cash Flow and balance sheets in The Market School portal. As boring as such topics are, I try to make it painless and quick, because, well, balance sheets matter.
Why? Because unlike sell-side jocks, bank analysts, and MSM pundits, cash flow statements don’t lie.
Eventually, those who know valuations know when to leave the herd and avoid the cliff…
Companies, for example, can fatten their top and bottom lines for a while (even a long while) with fat investments (i.e. from inflated share-price and debt-driven cash delivered by the Fed’s QE1-3 “bubble experiment”) in CapEx and working capital.
Such “cash infusions” compliments of rising stock prices driven by historically unprecedented low rates, corporate debt levels, stock-buy-backs, and bad M&A deals offered under the euphemism of Fed “stimulus” (i.e. drug pushing) won’t hit the P&L side of the balance sheets immediately.
That interim period is what we call “the good times.” And the times are certainly that for today’s tech juggernauts.
Eventually, however, those same juggernauts have to either achieve a commensurate (and hefty) increase in free cash flow or they will inevitably and mathematically hit that “uh-oh” moment of profitless growth and thus a sudden dive in valuation.
And here’s my take on the whole thing: those companies are never, ever, ever gonna achieve that “commensurate” increase in cash flow.
Instead, and like a cartoon character running past a cliff and suspended temporarily in mid-air, they are all poised for a painful fall—just like tech in April of 2000…
Don’t believe me? Tired of cow, cliff, ship and cartoon metaphors? I get it. Then let’s just do the math with a few of my favorite examples, Amazon, Facebook, Netflix, and Google.
Amazon…Good Grief
Amazon. I’ve written about this poster-boy of bubble valuation before.
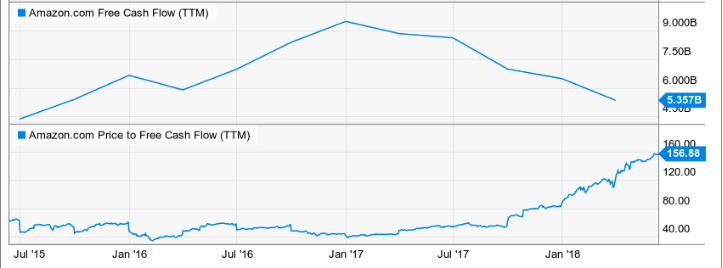
At today’s absurd valuation of $820 billion, AMZN is valued at 156X a free cash flow of $5.4B for the LTM period ending in March 2018.
The graph below, which compares Amazon’s Free Cash Flow (tanking) to its Price to FCF multiple (skyrocketing), puts this into a rather obvious visual perspective…
As I mentioned in the prior article and video on AMZN, its only profits come from the cloud (AWS), not from its otherwise infamous e-commerce model.
If you take its 2017 AWS’ sales and operating income out of the equation, Amazon’s e-commerce business generated $160B of sales, yet posted an operating income of negative $200M.
Please read that again. Because what the Amazon balance sheet tells you is that the great e-commerce “miracle” trading at all-time highs posted no profits whatsoever last year.
In short, virtually the entirety of Amazon’s absurd market cap gain is empty air—i.e. that cartoon character running right over the cliff and suspended in a moment of “uh-oh.”
Or stated otherwise, Amazon is a screaming neon-red symbol of absurd multiple expansion whose only and mathematical destiny—longer term—is a long, long fall to earth.
Ouch.
Facebook and Google
I touched briefly upon the balance sheets and business models of these two names in a prior article, here. But let’s dig a little deeper.
Facebook and Google, with market caps of $560B and $800B, respectively, have grown from cash multiples which can’t be sustained—despite all the fun we/you may have enjoyed riding their momentum trade.
Today, FB trades at 31X free cash flow and Google at 38X. Seems pretty impressive, No?
In fact, both companies are little more than online billboards who have capitalized on winning the war in the modern transition from print to online advertising.
Despite providing the cool technology behind the annoying ads (like ours…) which pop up on your screen, these companies cannot expect to see similar growth in a war that has already been won.
In other words, the best growth is behind them.
Unless both companies totally change their business models to one of paid subscriptions and other creative “sales” (good luck with that), their growth will soon revert to the mediocre mean of the advertising industry they have already cornered.
In terms of that advertising industry, it globally stands at $375B as a whole. Yet FB and Google are valued at nearly 4X the valuation of the entire industry? Seems a bit, well, absurd?
Sure, during the rapid shift from print and TV advertising to online ads, FB and Google saw their shares skyrocket with the trend, as between them, they account for more than two-thirds of the digital ad spend.
But even such impressive market share doesn’t entitle them to be valued at 4X the entire ad industry…
Besides, in the next recession, advertising revenues, like real estate jobs, won’t be in high demand…
Thus, for these two advertising houses masquerading as “tech” companies to expect similar sales growth in the next 5 years, one would have to believe that my fastball at age 48 is the same as the one I threw at age 20.
But I/we all know that the muscles eventually tire with time.
In sum, Facebook and Google’s 30-40X free cash flow multiples are unsustainable. More importantly, and with all the foregoing in mind, to identify these tired (and glorified) ad-agencies as “high growth tech companies” is simply, well “bad advertising.”
Netflix
Again, I’ve poked fun at Netflix in other articles (i.e. here), but I wanted to briefly revisit this infamous name as well.
Netflix is essentially just another Amazon in terms of being absurdly valued at an infinite multiple of free cash flow.
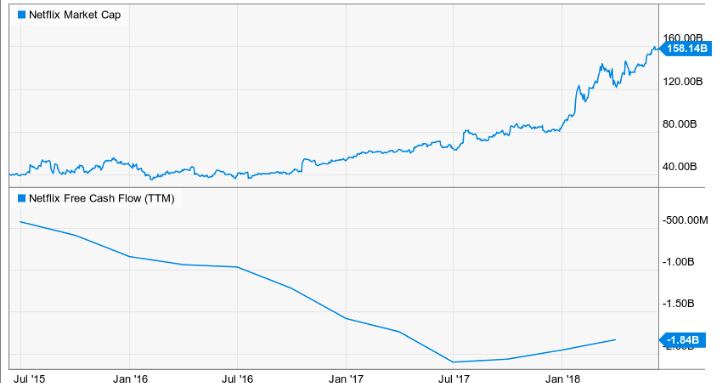
In the last three years, Netflix’s market cap has quadrupled upwards to $158B, while its free cash flow for the same period has more than quadrupled downwards to the tune of negative $1.8B!
Frankly: that just about says it all for Netflix…
And if pictures speak a thousand words, this pic (comparing market cap to cash flow) says even more:
What Next?
So, if you want to join the momentum train (herd, cliff, crowd, crazy whatever…) then keep holding on to your tech wunderkinder.
As for me, I’m watching for the inversion signals, be they tomorrow or a year from tomorrow, because the best way to profit from balance sheets like those above is to short them when their “uh-oh” moment comes.
Based upon the math, that moment is coming, and as all traders know, stocks tank much faster than they climb.
When the conditions are right, folks who understand balance sheets will have yet another shot at the next “Big Short.”
Until then, and as always, be careful out there.