
In Parts I-III of this blog primer in US markets, we’ve tracked how easy money from an errant central bank and mostly poor economic leadership (from FDR and Nixon to Greenspan and Bernanke), has led to drunken investor behavior and catastrophic asset bubbles.
We saw evidence of the above pattern play itself out in numerous forms: the crash of 29, Nixon’s inflationary gold de-pegging of the USD, currency wars, the Black Monday of 1987, the permanent distortion of the exchange pits and the MERC, derivative leverage (cancer), the fall of LTCM, and the dot.com mania/crash that began in the late 90’s.
In short, the evidence is fairly clear, as is the direction we are currently heading, for the pattern today is not only identical to yesterday’s catastrophes, its degree of risk has grown far worse.
But if you need more clues and examples of how we got here and where we are headed, let’s keep following our history and her patterns…
In the wake of the dot.com collapse of 2001, the subsequent sub-prime storm of 08 was not the only consequence of the Greenspan rate reduction and the “hot money” that followed. A wide and embarrassing swath of wasteful M&A, stock-by-backs and LBO deals (just like we recently saw at Verizon, Apple, Medtronics or the PE strip mining of the retail sector) that occurred under his watch provide yet further evidence that low rate/easy credit stimulus policies lead to bad behavior (and bad markets).
As expected, the post-dot.com markets were quickly deformed (“recovered”) by more easy credit, which led to a wave of secondary market speculation in which stock prices were raised not by the honest demand of free markets or product/service ingenuity, but as a result of the liquidation of shares purchased through massive turns of easily supplied leverage.
This new “hot money” was expressed in: 1) aggressive stock buy-backs (i.e. Cisco, Exxon, Microsoft, Hewlett Packard), 2) M&A mania (Time/AOL, JDS Uniphase/SDL, or the numerous companies WorldCom devoured), and 3) grossly mispriced LBO’s (Clear Channel, Alltel, Hilton Hotels).
Highlights of this low point in “American deal making” include GE’s dive from $50 to $10 share prices based on the fact that its finance company’s earnings reports were essentially $600B of risky, illiquid assets heavily propped up by mountains of debt ($800B) and hot money leverage. Net result? Did GE’s Mr. Jeffrey Immelt take his lumps courageously? Did the company learn the necessary lessons of reckless speculation in the fall from its 40X valuation peaks?
No. Instead, GE’s CEO took a bailout…
Additional examples of executive profiles without courage were plentiful in that pre-08 era of reckless borrowing and spending. The boards and CEO’s of countless unprofitable LBO’s shared over $300B in a carried interest jackpot while their publically traded balance sheets stayed permanently red. To twist the words of Winston Churchill, “Never before has so much been given to so few for so little.” Alas, this was the birth and mindset of today’s infamous “one percent” class.
This was also an intoxicated and unproductive era that ended (2008) in staggering write-downs on massively overvalued operations that were not close to profitable (but for their executive salaries).
Meanwhile, and in the backdrop to a wave of peak leverage and peak multiple PE deals (pricing at 11X EBITDA), the nation’s real (and ignored) economy dwindled as stock prices skyrocketed, demonstrating that stock market pumping does not trickle down/translate to national prosperity at the farm or commuter train level.
Between 2000 and 2007, when MBA’s were inventing derivatives and minting fortunes, nominal GDP grew by only $4T while total debt surged by $27T, meaning that for every six dollars of Fed-created leverage, only 1 dollar of national income was gained.
Hmmm… massive stock buy backs, a ripping stock market on the eve of its “08 Moment,” terrible LBO deals, enriched CEO’s and a dying Main Street…
Look familiar?
Excess in the corporate balance sheets (driven by excess at the Fed) was matched only by excess leverage in the rapidly growing hedge fund industry. Lurking behind the scenes of this pre-08 private and public equity bacchanalia were the hedge funds, whose growth story tells an equally disturbing tale of industry irrationality fueled by easy money speculation.
In 1990, the hedge fund market hovered at a modest $150B, yet after only two decades of the Greenspan/Bernanke money spigot, the same industry had grown to $3T, more than half of which was levered. The majority of these vehicles did little for either the real economy or the many accredited investors who lost money in strategies that rarely “hedged.”
Instead, most alternative investment vehicles (or “ALTs”) levered, churned and dumped. Indeed, honest industry professionals know that long-short funds are often (though not always) just levered equity funds, or “Lever Funds.”
In the well-used domino-chain of easy credit trickling from the Fed to the wire-house prime brokerage desks to the portfolio managers’ trade accounts, these entities fell (and continue to fall) in love with exotic strategies, viz: OTC trades, derivative embedded leverage cocktails and the perpetual flirt with margin calls stemming from short term borrowing and long-term betting—a Pavlovian pattern that inevitably fails when easy money bubbles pop and there’s no one to roll over the short term debt.
But prior to the 08 crash, hedge funds were like marauding U-boats conducting hit and run speculation investments in the takeovers, buy-backs and momentum/pump-em/dump-em LBO’s, including the roster of toxic deals string-cited above.
No history of irrational bubbles would be complete without a salute to the equally irrational real estate markets of 2004-2006. And the first name that comes to most minds is Fannie Mae, a GSE (“Government Sponsored Entity”) who, along with its cousins Freddie and Ginnie, grew astronomically in the 40 years following their accidental births in FDR’s New Deal era.
Indeed, the notorious exuberance and balance sheet ballooning of these operations is now the stuff of legend as a towering example of easy money prompting bad, very bad behavior—and this time with national consequences. In less than a decade, these mortgage lenders grew their balance sheets from $200B in the 80’s to $1.5T by 1992.
Heading toward the crash in 08, they had completely lost their way and were acting like hedge funds with mortgage pools levered at 200:1. In an era of egregious underwriting standards and fast money, these alleged real estate caretakers became dispensers of poison, indirectly setting the stage for increasingly bad practices, including the growth of predatory, boiler room mortgage brokers selling non–recourse loans to unqualified buyers whose paper was then consolidated, packaged, tranched and syndicated to the world as AAA securities.
Of course these packaged assets were just “pigs in lipstick” (Paulson) whose facade of value pushed the Case-Shiller Index up 60% by 2001, and then to a staggering 195% by the housing markets’ 2006 peak. Such unprecedented “growth” should have been an obvious sign of trouble, as it had nothing to do with intrinsic value but everything to do with easy credit.
Unfortunately, the real estate market then, like today’s real estate market, were too shortsighted to take their eyes off the immediate prize/profits and consider the longer-term risks ahead. In this bonfire of intentional blindness, the stock and option values of Freddie and Fannie skyrocketed. Like dot.com executives, these horrific GSE managers focused less on national interests and more on the need to keep earnings growing to justify market prices and annual bonuses.
This meant they had to continually dig deeper into the pigpen of poor credit borrowers to churn and generate more toxic yet tradable loans, 80% of which were to be re-syndicated into the growing real estate and sub-prime Wall Street bubble. (The Chinese, by the way, bought over $1T of this GSE toilet paper).
Needless to say, the GSE’s, like most of the LBO, PE and M&A deals of the same era (above), were not real businesses contributing any actual value to the US economy. (As their stock prices roared, US GDP by 2006 was at its worst since the 1930’s).
The seduction and temptation of easy credit had spread from the Fed, to the trading floor, the exchange pits, the hedge fund offices and banking towers all the way to Washington DC’s GSE sector, which was originally designed to carry out modest policies for national interest, not stock pumping and chest puffing on the Georgetown party circuit.
Sadly, Fannie and Freddie had thus morphed into yet another tool to inflate stock prices and chase short-term profits on a market gambling floor backed/bankrolled by Fed policies. What is more, these GSE’s took a percentage of their profits to fund K Street lobbyists paid to convince the policy makers that more poor people needed to be shoved into unscrupulous loans they could never actually afford.
The net result of this Fed-created, low-rate, easy-money, rogue financing (from bank “wirehouse lines”) was, alas, a massive housing bubble, followed by an equally massive pop. This “pop,” moreover, did not result from a supply/demand failure of free markets, which hadn’t been free for a long time, but rather from an explosion of unprecedented credit expansion leading to the production of inflated stock prices.
In short, a continuation of a patterns seen over and over again…
As for 2008, all of us remember it well. By the year’s close, $5 trillion of stock value had disappeared…But this latest catastrophe was built upon an even shakier foundation (2003-08) than prior bubbles, including the dot.com meltdown of 2000. That is, by 2008, the Fed supported markets had invented even more complex and pernicious tools of leverage and speculation –namely an unregulated derivatives market, which gives entirely new meaning to the expression “form over substance” as veritable leverage monsters which Warren Buffet aptly described as “weapons of mass destruction.”
Today, the notional value of these derivative instruments exceeds 9X global GDP. That number alone is simply astounding. Staggering. It is the off-balance-sheet ebola market virus no one wishes to discuss or consider. The implications of such leverage cannot be stressed enough, and yet 9 out of 10 market professionals aren’t even aware of the statistic or able to explain what it means.
The pre-08 crash was also characterized by such “cutting edge” Wall Street strategies as “flow trading”—a fancy term for aggressively accumulating (i.e. levering) assets by borrowing against them in the form of short term repo loans and then re-investing the borrowed money in long term speculation.
Key to this model, of course, is being able to constantly roll over and satisfy the short-term debt that feeds the speculation/leverage machine which in turn fuels the majority of hedge fund and investment banking trades, from Salomon Brothers to Citigroup.
Of course, once the portfolio managers could not make these short-term loan payments, the house of cards fell on the so-called “market masters” (little more than over-levered/paid gamblers) from Goldman to Morgan Stanley, who since the 2000 repeal of Glass Steagall, were no longer white shoe advisory and retail brokerage firms, but lever-happy prop desks/black boxes retaining reward while allocating all the risk to the shareholders.
When the sub-prime contaminated balance sheets left these banks too insolvent to pay their leverage commitments, a true free market would have carried them out of Wall Street in blindfolds and cigarettes for a well-deserved execution.
Instead, the Bernanke Fed (taking its cue from a Treasury Secretary who once led Goldman Sachs) chose the less free-marketed and hence less natural approach (his back was admittedly against the wall). Rather than throw a rose on the graves of busted banks, Bernanke (i.e. our Fed) opted to bail them out, thus giving new life to the very foxes who just raided the Wall Street henhouse.
In many ways, Bernanke’s reaction to the latest US bubble was the darkest period of American free markets, which were –and remain to this day– un-free and mismanaged by a central bank that consistently fails to accept the pattern of its glaring mistakes, i.e.: 1) creating market bubbles doesn’t create GDP growth, and 2) preventing free markets from punishing levered speculators merely encourages more speculation, more dangerous schemes and thus more disastrous consequences.
And what was the net result of our most recent bubble? By now, there’s neither suspense nor surprise.
Once again, standing in the wreckage of the popped bubble of 08, Uncle Fed responded once again to his spoiled nephews on Wall Street with more money, this time much, much, much more money. Bernanke began by immediately expanding the Fed’s balance sheet by $900B in seven weeks.
He also shut down the money markets to prevent free markets from raising rates to cleanse/rinse the markets of over-levered players—including Goldman Sachs, Morgan Stanley, Merrill Lynch, AIG, Bear Stearns, Lehman etc.—none of whom were in fact “too big to fail,” a term used to cover one of the biggest myths/lies of American market history.
And then the real spending kicked in…
We stand today at the edge of a market cliff built upon unprecedented levels of post-08 debt and money supply expansion. The current deficit stands at $20 Trillion (doubling its 2008 levels); money supply is up 500% (representing more money creation in the last eight years than in the previous century combined). This “binge,” of course, has been falsely presented to the masses as a “recovery.”
Such data demonstrates that nothing has changed (or was learned from) in nearly a century of market manipulations save for the scope and type of the bubbles created, and hence the scope and type of corrections to follow.
Because today’s bubbles are currency and debt bubbles, the cycle will end here, as there is nowhere left to extract rescue capital (more below). In sum, the coming storm will exceed prior crashes in size and degree. This is not a theory, but an historical inevitability—as all the above examples/symptoms confirm.
In prior corrections (1987, 1998, 2000 and even 2008) the “bubbles” were specific to particular and over-inflated asset classes or sectors (i.e. dotcoms in 2000, housing prices in 06, or sub-prime mortgage instruments in 2008). Despite their magnitude and excess, these popped bubbles were, at least… affordable.
That is, when they inevitably imploded and sent markets and confidence levels downward, the Fed had the means and credibility to re-inflate the markets via low rate policies (post 2000) and staggering money creation (post 2008). Given the historically unprecedented cost of the current false recovery (stimulated entirely by post 08 “money printing” and low/zero rate polices), the US balance sheet is now tapped out. Policy makers have no more means to “bail out” its own bailout policies.
In other words, the rich uncle is broke.
All the more reason to be watching this September’s debt ceiling fiasco play itself out…
Today we are the inheritors of the market history described in this four-part series. As such, we owe it to ourselves to understand it, so that we can best prepare for it. In short, we stand at the edge of this history and the patterns it reveals.
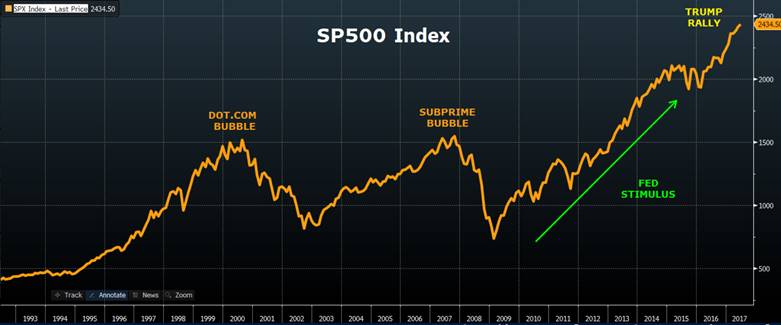
If easy money leads to market bubbles, bad investing and market crashes, then we all can see what’s coming. Since 2008, money has never been easier, investing has never been “badder” and bubbles have never been bigger. Just look at today’s absurd S&P…
So you see, I’m not a bear, I’m more of an historian…
As I’ve detailed in other posts, the culmination of the foregoing history of postponing and exacerbating pain via panacea (easy money) policies which inflate asset classes rather than permit free market corrections is a failed experiment, the full extent of which will be revealed in the collapse ahead.
Doubling debt levels and quadrupling deficits without posting GDP or real employment gains makes this painfully clear. As bond, credit, IPO pricing and bad LBO’s reach new highs in this backdrop of failed indicators, we have to take words like “collapse” more seriously and replace the glossy brochures and market cheerleading with somber courage and historical perspective.
This is not panic. It’s intelligence. It’s fairly simple. It’s also unpleasant. But more importantly: it’s history and it’s easily verifiable.
This week (8/21) begins with markets near record highs, and yet most of us are catching on. It doesn’t feel…”right,” and this is because it’s not. In the coming years, months or seconds (I can’t time it), history is about to repeat itself, because history has been forgotten.
Spot on with this write-up, I absolutely think this web site needs a great deal
more attention. I’ll probably be returning to read more, thanks for the advice!