
We use a litany of market charts and data points to better inform the probability of an up or downward trending market.
23 shares
On Monday, May 20, markets opened with the S&P 500 down .67% on news of the trade war.
On Tuesday, they recovered.
On Thursday, they were down more than 1.19%.
Now, as you know if you’ve been following Signals Matter, there’s something much worse than that coming to the markets down the road, once the inevitable Fed policies to come (i.e. more money printing) fails to work. But until then, expect more Fed support in the fall after a bumpy fall. Market charts are telling us there’s risk ahead, which means, ironically, a big tailwind as well by year-end, as the Fed will be adding “steroids.”
So it’s more important than ever that you know exactly what’s coming, when, and what to do about it.
That’s why, as you enjoy this Memorial Day weekend, I wanted to show you precisely what the Signals Matter Storm Tracker is currently saying about the distance to a coming recession.
And most importantly, how to best prepare your portfolio.
Let’s get started…
The Four Blips on the Storm Tracker You Need to Know
Last week was a tough week on the global-macro front, comparatively speaking.
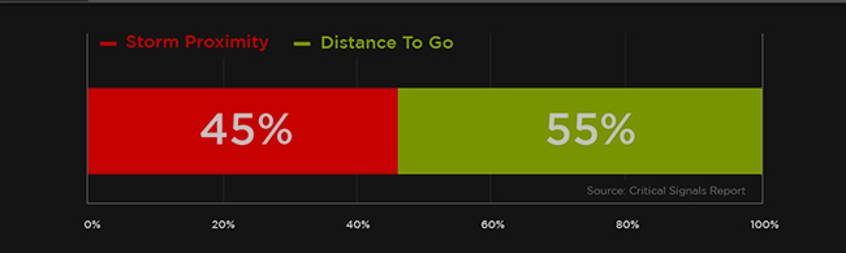
First and foremost, the Storm Tracker ramped up a few notches from 39 knots to 45 knots.
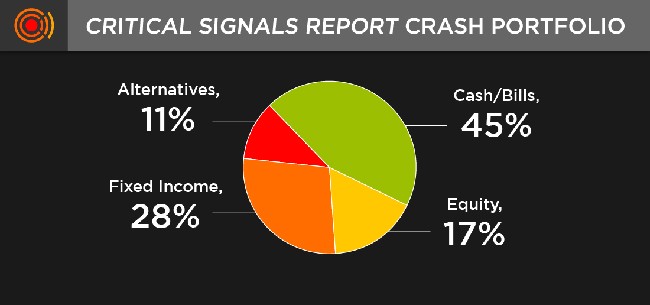
As I said before, the recessionary wind speeds are at 45 knots, then your cash position should be 45%, as you see in this chart here.
The Storm Tracker parses nearly 100 variables, which means quite a few of these are deteriorating.
Everything you see in Signals Matter flows from the Storm Tracker and the market charts it tracks.
It sets the pace for the week ahead and importantly impacts the cash position in the All-Weather Portfolio which our subscribers enjoy.
We’ll get to that in a moment.
For now, let’s quickly parse what’s changed since and what the market charts are telling us since I recently introduced Storm Tracker to you.
First, consensus recession probabilities are rising … sharply.
Here’s a chart of the NY Fed Recession Probability Indicator, which has reliably increased ahead of past recessions.
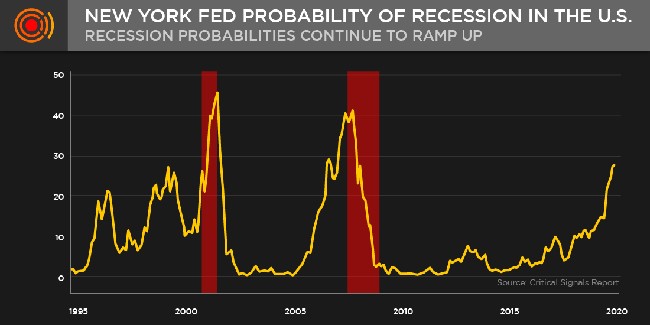
The New York Fed’s current probability of a next recession rose to 27% last week.
As you can see from the chart, this is about where it was when the 2001 recession kicked in.
Then there’s the 2008 recession, which kicked in at a 40% reading – and we’re over halfway there today!
The obvious take away here is that recession probabilities are mounting, even at the Fed.
Thus, you need to prepare.
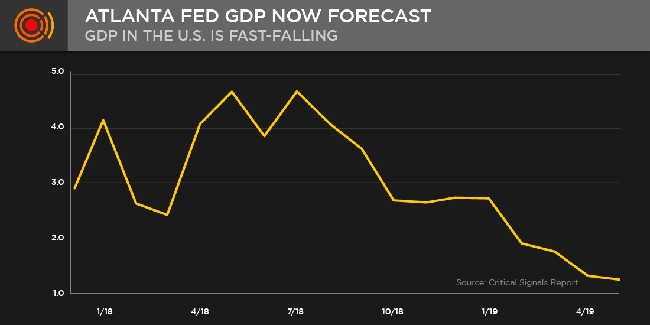
Second, U.S. and global GDP growth forecasts are falling … sharply.
As we’ve written elsewhere, the Fed doesn’t report GDP with a great deal of accuracy…
Nevertheless, for public GDP forecasting, we like the Atlanta Fed Now Forecast for the U.S., as it updates so frequently.
This chart, among our many market charts, is about as concerning as it gets.
The Atlanta Fed is suggesting GDP will fall 75% from its highs back in July of last year.
Here at Signals Matter, I’m currently tracking a recession to hit landfall (i.e. your portfolio) in Q1 of 2020, unless of course the Fed has stepped in and begun more money printing, which frankly, is to be expected by year-end…
By this metric, and for now at least, it already appears well on its way. More market charts…
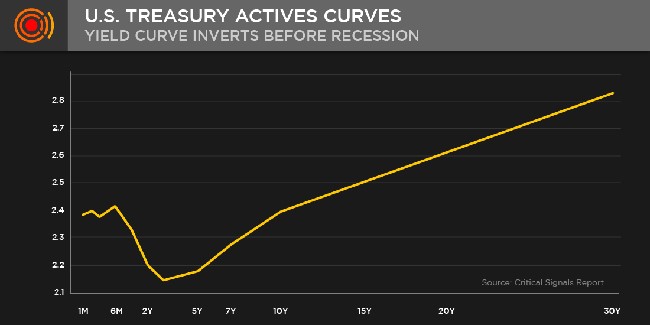
Third, the U.S. yield curve continues to invert, as it frequently does before recessions.
A total of 4 legs are pointing down (inverting) in the US Yield Curve below.
A leg down was added recently, contributing to the rise in our Storm Tracker reading.
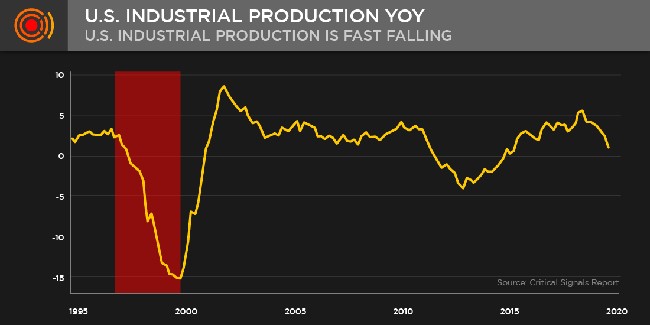
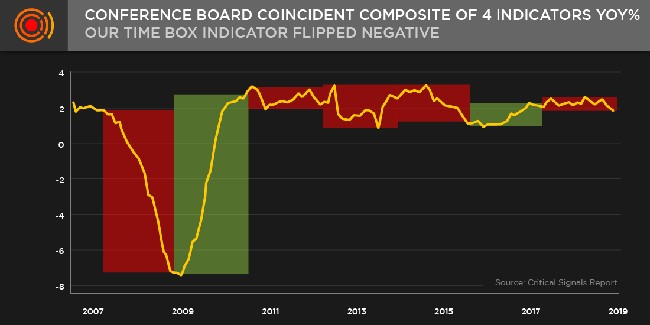
And fourth, two of our more important leading indicators and market charts flipped from bullish to bearish over this last week.
Namely U.S. Industrial Production and the U.S. Conference Board Coincident Composite Index, an index that tracks economic variables that tend to change with changes in the overall economy year-over-year (YoY).
Take a look.
And…
What to do?
Stick with Signals Matter, where I’ll be showing you how to prepare and what to do, and backing this with market charts not opinions.
Here’s what’s broadly indicated now … and what’s working now …
Namely there’s a healthy risk-management allocation to cash (45%, equal to Storm Tracker’s Recession wind-speed reading), and the rest to fixed income, equities (long and short) and to alternative investments.
As we move forward here at Signals Matter, I’ll be sharing more specific allocations and market charts within these sectors, but here’s a preview …
They include allocations to long large cap stocks, short equity indexes (some leveraged through inverses), and a whole lot to U.S. and global fixed income to enjoy some appreciation as investors pile into bonds.
Bottom line: storm clouds are gathering as trade wars and other “stormy” indicators loom larger week by the week, although the possibility of a Fed-driven “melt-up” looms, should we see autumn volatility (expected) and hence a Fed forced to either take those short-term interest rates down a couple of notches and/or print more money in order to revive a deteriorating stock market.
Have a great weekend, and of course, on this special holiday, we give a deeply heartfelt thanks to all who served our country and to those in particular who gave their lives doing so.
We remember them with the highest of highest regard.
Comments
6 responses to “The Five Charts Every Investor Needs to See Right Now”
- DUKE RONZETTIsays:
May 25, 2019 at 5:39 PM
WHAT ABOUT CONSUMER DEMAND ?DEFINITELY ON THE RISE CONSIDERING MILTON FRIEDMAN’S PERMANENT INCOME THEORY– WE KNOW THE U.S. GOVERNMENT JUST KEEPS SPENDING AS IF THERE IS NO TOMORROW OR ANY OTHER CONSIDERATION, ALSO THE POSSIBILITY FOR MORE SIGNIFICANT MILITARY SPENDING LOOMS ON THE HORIZION– MY GUESS THEIR/TOTAL U.S. SPENDING WILL RISE DURING THE NEXT 3 QUARTERS– CONCLUSION, RECESSION FEARS ARE OVERBLOWN BUT THERE IS A CASE FOR INFLATION- I DON’T HAVE MONETARY GROWTH FIGURES HANDY– MY GUESS IS THE FED IS BEING VERY ACCOMMODATIVE, THUS MOLLIFYING A RECESSION– DUKE RONZETTI, ECONOMIC AND FINANCIAL CONSULTANT, 352-301-4425
- Bill Kummerersays:
May 25, 2019 at 9:45 PM
Nice reports
- Richard Comansays:
May 26, 2019 at 4:00 AM
Will the Fed increase interest rates to protect Treasuries ?
- Jose Luis Martinezsays:
I like to buy or sell puts and calls. But have difficulty understanding market
movements
- jack kimura says:
May 26, 2019 at 4:09 PM
It is good to see this stand point approach. I appreciate this.
- Elvira Gran says:
June 25, 2019 at 6:42 PM
Good day! I could have sworn I’ve been to this website before but after checking through some of the post I realized it’s new to me. Anyways, I’m definitely happy I found it and I’ll be bookmarking and checking back often!