These are scary markets which demand informed data and calm preparation.
How COVID-19 Collides with Unparalleled Debt and an Ill-Prepared Global Economy
In this Market report, as well as in the video link, here, we’re going to pause and place central bank extremes, COVID-19 virus implications, ballooning corporate debt and an ill-prepared global economy into a tidy, blunt perspective so that you can see clearly what we are seeing, and expecting, when it comes to stocks, bonds, and the broader markets, informed by data, not opinion. We’ll also share how our portfolio is crushing the borader markets in both absolute and relative performance.
More importantly for Your Portfolio, we examine with equal objectivity what you can expect going forward and thus how to be prepared rather than be pinched as these scary markets gyrate.
First, the Bond and Rate Markets
As we all know, just last week the U.S. Fed delivered an emergency 50 basis point (0.50%) rate cut in response to the increasingly alarming Coronavirus Crisis.
On Friday, treasury yields across the board raced to bottoms NEVER seen before in U.S. history as investors flocked into safe haven instruments.
No surprise there. That’s because there’s another rates market, i.e. in the repo market, that informed this would happen. Never mind that Powell and other desperate Fed members declared just three weeks ago that they foresaw no rate cuts at all for 2020.
How did we immediately know that this was pure nonsense? Simple: The repo markets told us.
Never Overlook Signals from the Repo Markets
Unlike the mouth-pieces and double-speak at the Federal Open Market Committee (FOMC), the markets themselves can tell us what we need to know, so long as one knows where to look.
Unfortunately, ninety-nine percent of retail investors did not see this because 99% of the media neglected to report that the Fed had already been reducing short-term repo rates by the same 0.50% well before the official rate reduction in the Fed Funds Rate was announced.
Folks, one should not underestimate or overlook what is going on there. Let us show you with some graphic perspective.
Buckle up. It’s not pretty.
The Fed in a Quiet Corner, Scissors in Hand
As we’ve been reporting for over a year, the Fed needs to keep the yield curve (i.e. the yield on U.S. Treasury bonds) rising and upward sloping rather than falling or inverted.
That’s because inverted yield curves scream recession ahead. The Fed already straightened out the yield curve late last year. But now the yield curve is inverting all over again…and that’s scary.
In simple speak: The Fed is terrified of a crazy-scenario (seen twice in 12 months) of an inverted yield curve in which holders of longer-term bonds (and hence risk) get less yield (and hence return) than holders of shorter-term bonds.
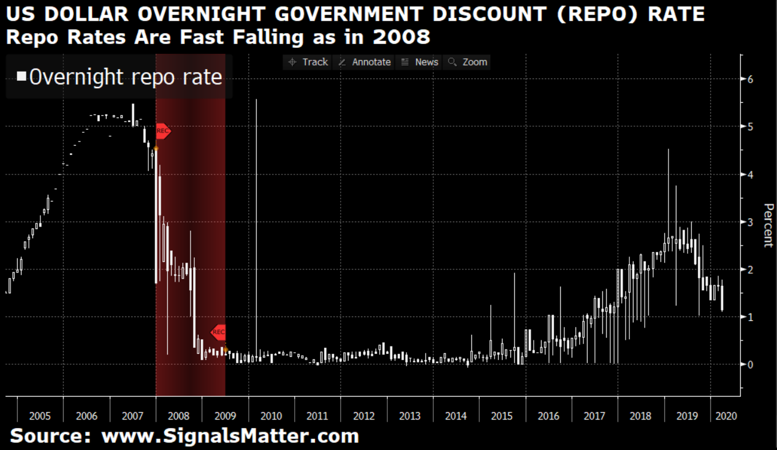
While all eyes were thus glued on Powell last week as he cut rates dramatically to a 1.25% upper bound, no one noticed what had already transpired in those murky corners of the repo market, where the much shorter-term Treasury credits move/trade.
Let’s take the 3-month Treasury Bill, for example.
Rates on 3-month Treasuries were steadily cut by the Fed on February 22nd, again on February 28th and yet again on March 2nd, from 1.53% to 1.13%.
Which means that before the headline-making cuts to the Fed Funds Rate last week, the Fed had already been slashing rates on the shorter end of the curve by the same 50 basis points.
In other words, last week’s dramatic rate cut was merely the Fed acting to keep its Fed Funds Rate in alignment with the already compressed/cuts made in the February repo markets, rather dramatically illustrated below, far-right hand side of the chart.
Why the need for repo rate cuts and intervention?
Simple: The system is quietly getting sicker by the day. That’s a bad thing.
Overnight repurchase (or “repo”) rates are absolutely critical to keeping Wall Street and their too-big-to-fail (TBTF) banks humming, based upon pledged collateral.
Unfortunately, not enough good collateral to pledge is out there; thus not enough fast money is available to flow into the repo markets to keep rates low and safe.
That’s why the Fed has to step in during times of crisis.
And if you’re still thinking this is not a significant crisis, let’s just look at the facts and make this painfully clear. Consider the graph below of Fed intervention in these over-night repo markets:
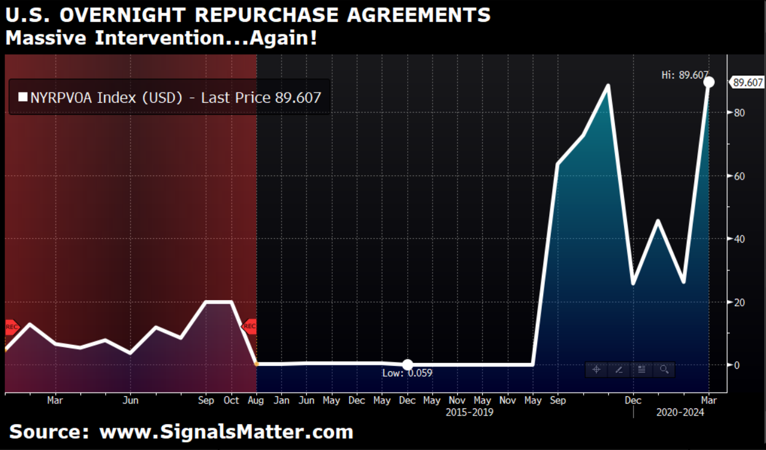
“Accommodation” like this is reserved only for very rare and dire circumstances. During the 9/11 attacks, for example, the Fed stepped in with $80 billion in a single day to “calm” the repo’s scary markets.
During the Great Financial Crisis of 2008, when Lehman Brother’s lost its mind (and margin accounts), the Fed once again hit the “uh-oh” button and stepped in with over $100 billion per day to keep the wheels greased as ‘scary’ returned.
But folks, look over to the far right in the chart above, for you will see that beginning last September, the Fed has been supporting these broken and scary markets at the $100 billion per day level.
This means that despite Powell’s calm voice that all is “fine” in the economy, we are now seeing mathematically that even before the Coronavirus Crisis, Fed intervention in the repo markets was at levels higher than during both 9/11 and the Lehman Crisis of 2008.
Read that last line again. All is obviously not “fine.” Despite record high (and grossly over-stimulated) stock markets, the Fed is intervening at levels greater than the 9-11 emergency and 2008 financial crisis. That alone should more than tip you off as to how worried the Fed truly is.
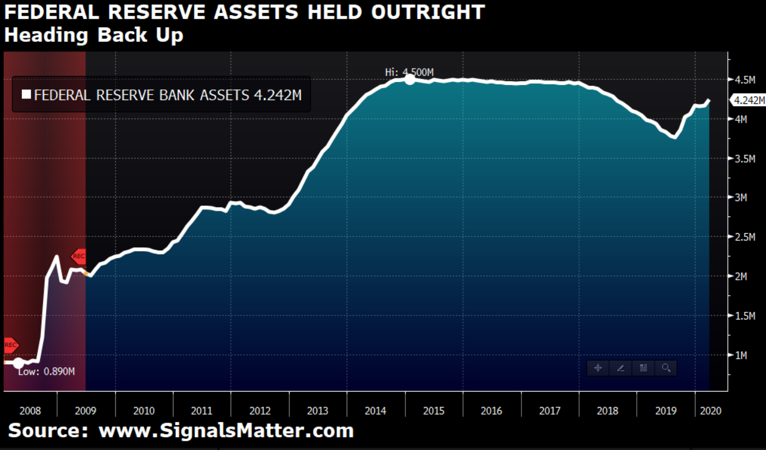
In addition to such “pure emergency mode” overnight loans to the repo markets, the Fed has also been riding at full gallop since last August in the regular and permanent open market operations to outright purchase short-term T-Bills (such as 3-Month Treasuries) at emergency levels ($2.4 trillion), a figure of direct support never reached before in the T-Bill market.
Total Fed assets held outright are on the rise again.
Why was so much emergency support otherwise ignored by the media?
Well… It’s because something troubling is heading our way and the Fed knows it. They’re scared.
So, what’s coming?
Market Implications of the Coronavirus’ Human Toll
The Fed expects the Coronavirus to further impact fragile supply chains and supply economics in a major way – going forward, not just looking backward. This is because the vast majority of the US Fortune 500 companies get the bulk of their products or components from China. What’s even scarier, is that greater than 90% of those products come from Wuhan, the epicenter of COVID-19.
Significant market and economic pain are now statistically inevitable from the projections made by the World Health Organization (WHO), the full impact of which has yet to be openly discussed by the Fed’s “open market committee.”
So, let’s do some of our own math and speculate reasonably (and openly) given the data at hand…
Coronavirus Numbers—Scary Indeed
Ira Longini, a top infectious-disease scientist and Coronavirus adviser to the WHO, has tracked studies of COVID-19 transmissibility in China. She recently announced that the highly contagious profile of COVID-19 could infect as much as two-thirds of the globe with a current death rate of 3.4%.
Given a global population of 7.7 billion, and assuming a contagion rate of just 50% (shy of the 2/3rds projections), the potential infected population could potentially reach a population of 3.85 billion. At a death rate of 3.4%, COVID-19 could trigger a tragic and potential human toll of 131 million global fatalities, should the virus not be contained.
We truly hope it will be contained. That said, we have to now rely on data and preparation, not just hope alone.
A human toll this extreme would have an equally alarming impact on the now deteriorating flow of goods and services throughout the global economy, and hence an alarming impact upon global markets.
Sadly, COVID-19 hits the global marketplace at time when a few other inconvenient truths lie just beneath the surface, for these same markets have already been made exceptionally vulnerable by (1) record debt levels ($250 trillion), (2) record-low GDP numbers and (3) extreme central bank stimulus seen globally in the wake of the 2008 Crisis.
This kind of pending and dramatic supply-chain disruption would trigger even more bailouts and bankruptcies, possibly at the largest levels seen in our history (see below), which is particularly scary given the fact that Main Street America and an ignored, yet dwindling middle class, are already (technically and mathematically) in an economic depression.
How Can the Fed “Solve” This Crisis?
Now to the solutions. How will the Fed and U.S. government engineer the mass bail outs and likely mass bail-ins for the banks that will be required?
This much we already know: The Fed can’t reduce rates much lower than they already are. That quiver has few arrows left, which leaves the Fed and D.C. deductively with only two remaining weapons, namely (1) more money printing (monetary stimulus) and (2) more deficit spending (fiscal stimulus), the latter now at $1.3 trillion per year and growing.
Unfortunately, these two remaining weapons are ultimately weapons of economic mass destruction when it comes to global currencies and further massive debt expansion.
Stated simply, this means our economy is mathematically headed into a perfect storm.
Hard to Fathom? It Gets Worse…
Not convinced? We don’t blame you. These facts are admittedly scary, and as such, hard to look at. But there’s more facing these scary markets.
Again, tighten that buckle.
Let’s look objectively at current U.S. corporate debt levels divided by current GDP, or debt/GDP levels.
As you can see in the chart below, whenever this ratio of corporate debt-to-GDP reaches a peak (i.e. greater than 40% of GDP), a recession promptly follows every time (as noted by the last three vertical grey columns):
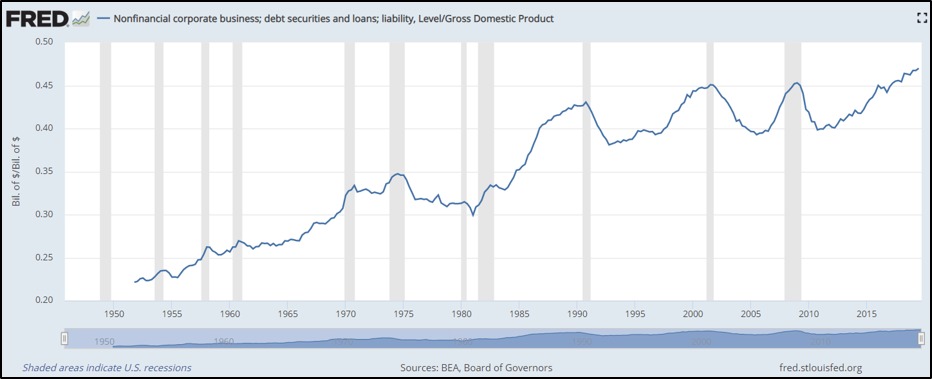
In the scary markets of the 1990’s, during the S&L crisis and recession which followed, the warning percentage was 43% of GDP.
Then came scary markets of the dot.com crisis/tech bubble wherein this debt ratio hit 45%, and we saw those wonderful names like Enron, Global Crossing, WorldCom, etc. implode.
Not long thereafter, and courtesy of the Greenspan-era stimulus, along came even more scary markets, namely the great disaster of 2008, in which this key debt/GDP percentages hit 46% and names like Lehman Brothers (a crash 7X the size of WorldCom and Global Crossing), Chrysler and GM imploded.
Ok, so now look above at where our scary markets sit today, namely at corporate debt/GDP ratios even worse than those prior 3 crises and recessions.
And what’s even scarier is this: Once our GDP tanks even further (nod to COVID-19) from pre-recession levels already in place, well, look out below.
At the currently undeniable and empirically-derived debt/GDP percentages upon which we now sit, this “uh-oh” moment is now inevitable and FAST approaching.
Blunt-Speak
Folks this is just history, math and data, not a scare tactic. I’m not trying to shock and awe you, but rather simply report bluntly on what we are tracking in these plainly scary markets. In sum, COVID-19, coupled with massive debt and insufficient GDP, speak for themselves.
The big and next question is what can YOU do now that you are aware of the storm that is coming?
Blunt Advice for Prepared and Informed Investors
For starters, this is a time when a smart-portfolio is needed to weather the coming storm, which means you’ll need to Subscribe Here to track Signals Matter’s Storm Tracker and our Portfolio Solutions.
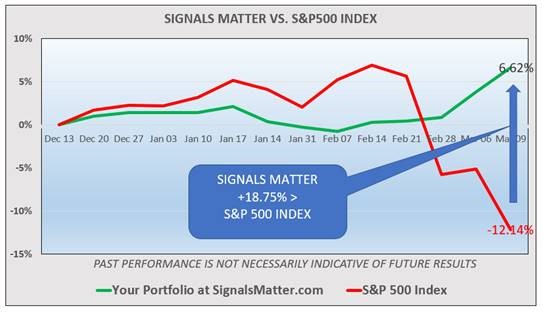
As this storm has brewed since mid-December 2019, portfolio suggestions at Signals Matter had already outpaced the S&P 500 Index by a whopping 9.39 percentage points in just shy of 3-months by Friday’s close. And as of this morning’s open, we are picking up the pace of making absolute returns while crushing the S&P’s performance by a staggering 18.75 %.
That’s why we call it an All-Weather Portfolio, a safe port in any weather-pattern available to Signals Matter subscribers only.
But there’s more to consider…
More Printing & Record Deficits
This we much we have learned…there is more deficit spending and money printing ahead to “solve” this trifecta of problems (COVID-19, rising debt and insufficient GDP). That means more debt and more money creation/printing.
Crazy?
You betchya.
But here it comes.
Here’s some more math. As recessions set in, tax receipts fall and GDP tanks even further. Leaving the stock market (directly correlated to all of this) to fall in tandem.
Again, just math, folks, no forecasting here.
To solve this inevitable convergence of math, history and common sense, we can expect record-breaking levels of debt monetization (i.e. printing money to buy our own debt), currency creation and multi-trillion-dollar deficits in the years ahead.
When record levels of money are created, they have to go somewhere. And for over a decade, they have gone straight into the stock market.
Equally true is that whenever emergency currency is created at massive levels, the purchasing power of that currency gets neutered.
To keep stock markets afloat, which is critical to governmental survival, D.C. and the Fed will have no choice but to step in, print gobs more money, and much like Japan, start using that money to literally buy stocks.
Not convinced?
Just weeks ago, former Fed Chairwomen Janet Yellen, who once said there would likely never be another recession in her lifetime, is now saying that in the next recession (apparently she’s changed her mind), the Federal Reserve may very well have to go into the markets and buy stocks directly.
Well folks, that’s certainly not a free-market system, and that’s certainly not capitalism, but as we’ve explained at length elsewhere, free market capitalism died long ago…
Crash, Deflation, then Inflation—More Gold-Speak
Printing money to buy stocks as the next crash unfolds eventually means deflation is around the bend in a crash-case.
And deflation could put a temporary reign on the price of gold, and possibly send this and other precious metals like silver into a temporary pullback ahead. Furthermore, whenever and if-ever there is a “fail” in the repo markets, exposed parties are forced to sell their good assets–i.e. gold–in large amounts, further sending gold prices temporarily downward.
Regardless of such pullbacks, we have always said that gold is an obvious currency hedge and hence insurance policy against a world and central-bank-money-printing system gone rogue.
That world, and that system, for all the reasons shared above and in months of prior reports, is indeed going rogue.
In the long run, as the money printing really kicks in during the post-crash and extreme inflationary/money-printing “policies” ahead, gold has nowhere else to go but up in the long-term.
Again, we’re not gold bugs, we’re not even bulls or bears, inflation or deflation debaters. We just track the data, the scary markets along with their signals, and then report/translate the same back to you.
As always, we’ve stayed consistent in our message that these markets were and are rigged to fail, for all of the reasons carefully outlined here and here, and for which our portfolio has performed remarkably well, as per above.
Bottom Line
There’s more volatility and discomfort to come as the above-described human and market implications of the Coronavirus Black Swan continue to evolve as the likely tipping-point for fragile markets already made sick by central bank extremes.
Again, subscribers to Signals Matter have known this for quite some time and are prepared. As I’ve said and will say again: It’s not doom or gloom—just common sense with a twist of market skill.
If you see this as well as we do, then join us by subscribing here or by reading our Number #1 Amazon New Release, Rigged to Fail, by clicking here.
Now is NOT the time to rely on the media alone to stay informed. The markets themselves will tell us all we need to know, and Tom and I know where to look for those market’s signals. We’d love to have you in our community of informed, patient and smart investors.
In the interim, we once again remind our subscribers to visit their dashboards and see in greater detail What’s Happening Now, What’s Ahead, and what to do about it by way of Your Signals Matter Portfolio.
Folks, stay informed, stay safe—these are scary markets for sure.
Sincerely,
Matt Piepenburg