Now, more than ever, investors need a smart portfolio …
Well, as markets just saw their worst week since the 2008 Crisis, investors are wondering if this is the big “Oh-Uh” moment of which we’ve been warning in this truly rigged-to-fail market.
The short answer is this: Not yet.
But when one has a smart portfolio, the timing question is not as important as the preparation question, and those with a smart portfolio are always prepared.
As to the boom-to- bust cycle we track, the current markets remind me of Churchill’s famous observation in the Second World War: “This is not the end. It is not even the beginning of the end. But it is, perhaps, the end of the beginning.”
Why? Because the Fed, despite what they say, will have no choice but to print more money and reduce rates yet again to keep repo and Treasury markets afloat in the volatility to come. Those with a smart portfolio will be ready.
This means more dip-buying is expected from what are now “robo markets” traded more by algorithm programed computers rather than breathing humans.
Folks, we live in a Twilight Zone of negative yielding bonds; even here in the US our government bonds, from the 2 Year all the way out to the duration-risk saturated 30-Year Treasury, when adjusted for inflation, give you a negative return.
This means, in essence, our Treasury bonds are defaulting bonds and thus not much of a “safe haven.” In essence, and even in a smart portfolio, bonds like this are mere “shock absorbers” rather than income generators.
Things are so upside down that investors today pay to lose money, which means a Treasury is less of a “risk free return” and more of a “return-free risk,” that boils down to nothing more than a constructive “tax” on investors. The only play in bonds is price appreciation, not “yield.”
In short, we can now call government bonds what they really are: “Tax bills”…
Investors are basically looking to the bond market for “price appreciation” and the stock market for income (through dividends paid for by debt), underscoring, again, how the Fed has completely distorted the traditional markets of yesterday.
Needless to say, this means the traditional portfolios of yesterday are not suited for such a reality, and further explains why our smart portfolio is crushing the old 60/40 stock/bond “diversification” model of the old days.
More on that below.
Let’s get started.
Subscribers to Signals Matter understood this long ago in their own smart portfolio, and for those of you still wondering what they and we know, let’s dig in and show you how we operate.
Seven Ways to Know What’s Going On
To see what’s going on to inform a smart portfolio in this particularly memorable moment of market pain, we’re sharing 7 insights below that pretty much sum it up.
As we pen this note, the Dow Jones Industrial Average has fallen by 12% and counting, and that’s not just because of the Coronavirus, as we explained in Sick Markets or Just Virus Blame.
In short, the virus is just one of many “pins” pointed at a market bubble long-ago poised to pop. Or to use another image, our markets are just a bug looking for a windshield, and this last week was a helluva a windshield-meets-bug moment.
1 – Global Heat Maps
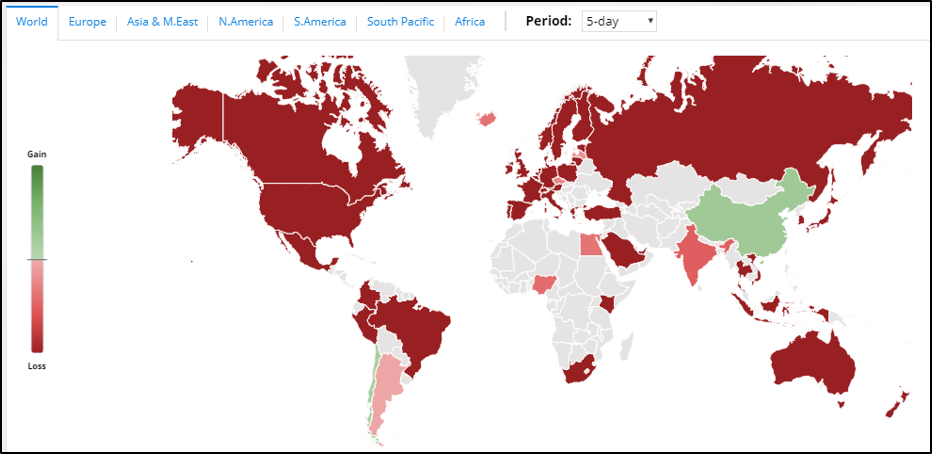
Global Heat Maps are a handy way to see just what’s going on in the equity markets at a glance and thus to inform a smart portfolio.
Take a glance then at the Global Heat Map below that tracked the ups and down in the global stock markets for the last 5 days.
Here’s what the Global Heat Map is telling us now, and it’s pretty simple.
For the last 5-days, world stock markets have been falling in synch, i.e. in a highly correlated fashion. When it comes to stocks alone, there was just nowhere to hide.
Signals Matter’s Global Heat Map is now available to Signals Matter Subscribers Only.
2 – Market Watch
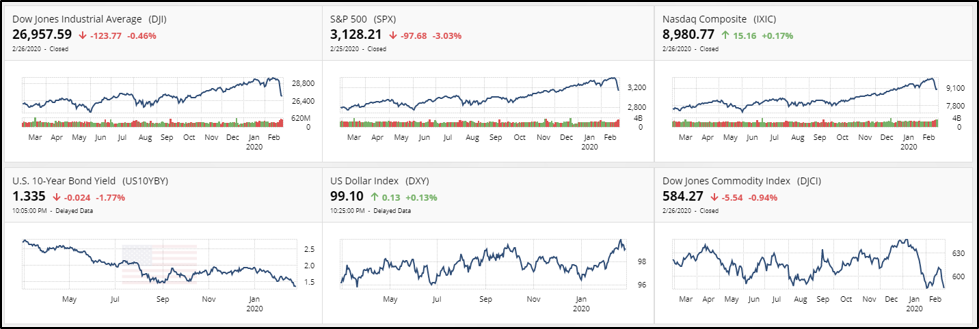
The Market Watch tickers below display the Thursday mid-day performance for U.S-based Stock, Bond, U.S. Dollar and Commodity Indexes.
Just a glance at the Market Watch faceplate says it all for the last week, all of which informed positioning for a smart portfolio.
Stock indexes were down across-the-board, yields were being pinned to the floor in a massive “flight-to-quality” (?) toward bonds (aka “tax bills,”) the U.S. dollar was/is soaring (as expected) in a nod to relative currency quality and commodities are in the tank, with multiple tests of commodity lows underway.
Signals Matter’s Market Watch is now available to Signals Matter Subscribers Only.
Gold, however, saw a pullback, which is to be expected, as stock-bleeding investors sell what was valuable (gold) to cover their losses in stocks. This expected trend down in gold can continue, but remember, we hold gold as long-term currency insurance, not as a speculative play in our smart portfolio.
3 – Timely Charts
By now you know we love charts! They tell so much, so quickly, to so many, and give confirmation to the signals we offer in a smart portfolio.
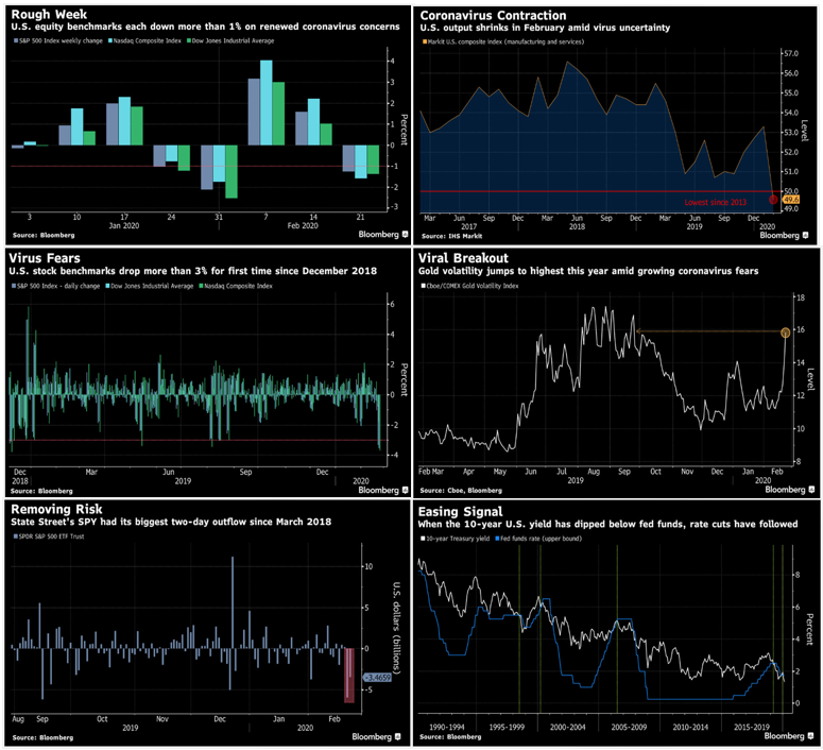
Multiple charts inform on trends. Recent timely charts tell the story of the Coronavirus and its impact on the stock and bond markets late in the current week.
That chart in the lower-right below is REALLY important to explaining a smart portfolio. It changes the narrative (and focus) from what’s currently happening to stocks to what’s gonna happen to interest rates.
It’s important because, with stocks falling as fast as they have been, it begs the question as to whether the Fed is about to “save the day” yet again and artificially lower short-term interest rates.
Our guess is they will, because this chart shows that on the rare occasions that the 10-year Treasury yield has traded below the Federal Reserve’s target rate, significant rate reductions by the Fed to lower borrowing costs even closer to zero and “recover” an inverted yield curve have tended to follow.
The yield curve is, after all, inverted and inverted yield curves usually portend recessions. The Fed knows this, and are terrified of a sell off in stocks at places like Vanguard, Blackrock etc—where a 20% redemption by scared investors would result in trillions of market-cap losses.
The 10-Year U.S. Government yield (or “tax bill”) dropped to a record low of 1.34% on Wednesday this week, below the Fed Funds Target Rate.
This is just crazy, as those holding 10 Year (or even 30 Year) bonds are basically getting no better yield than those holding a 2 Year bond, and in both scenarios they are losing money.
Here’s the rub. If the Fed keeps lowering interest rates (or heaven forbid, is secretly benchmarking to the stock market as we discuss in our new book Rigged to Fail on Amazon.com), we’ll hit negative nominal rates soon enough and then all bets are off.
But again…when adjusted for inflation (even as falsely reported as inflation currently is), investors are already getting negative real returns for their bonds, and a negative yielding bond is really nothing more than a defaulting bond and thus a constructive tax on bond-holders.
Signals Matter’s Timely Charts/Comments is now available to Signals Matter Subscribers Only.
Crazy? Rigged to fail?
Yep…
4 – Sector Watch
Watching sectors rotate is another invaluable way we track what’s happening now for SignalsMatter subscribers and our smart portfolio, aspects of which we share with you here.
This tool allows us and our smart portfolio to see where the trends are going for virtually every security charted.
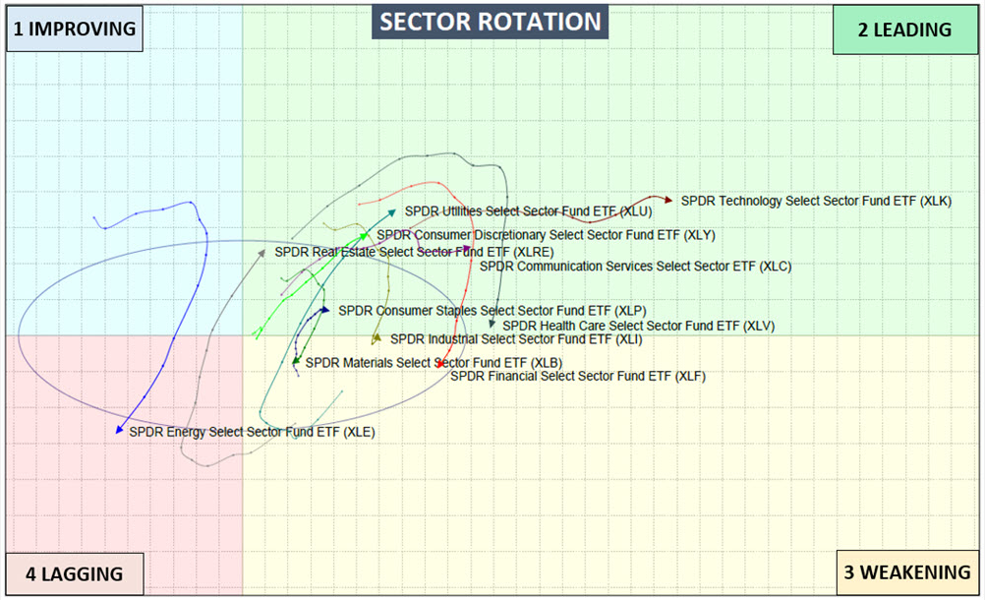
Below we’ve charted all 11 SPDR sectors and display their recent rotation on a weekly basis, week-by-week (with weeks noted by the dots in each trailing line).
Sector ETF’s are plotted as improving (Quad-1), leading (Quad-2), weakening (Quad-3) or lagging (Quad-4).
In normal markets, sectors typically make (evolve) their way around the horn in a clockwise fashion, helping investors in a smart portfolio know when to buy, when to go flat and when to flee certain sectors or even go short.
Sector Watch is telling us that once wavering/crowded sectors are now giving way to a more southerly direction. That is, they are trending away from the “Leading” quad and crawling toward the “Weakening” quad.
Have a look at the number of downward arrows mounting. Even our lone holdout sector (Energy) in the Improving Quad below has been knocked out and is now making a regressive move in the wrong direction – back into the Quad 4 Lagging Sector.
That’s unusual. These Sector ETF’s generally rotate forwards, not backwards with the momentum we were seeing in energy, now lost as oil prices hit $50 and energy companies stare at defaulting loans.
As for that oh-so sexy Tech Sector, it’s currently hanging on in the upper right “Leading Quad,” but note how it is flattening out. Using such tools to inform a smart portfolio, we expected such sectors to begin succumbing/falling as early as this week…and they did just that.
Signals Matter’s Sector Watch is now available to Signals Matter Subscribers Only.
5 – Storm Tracker
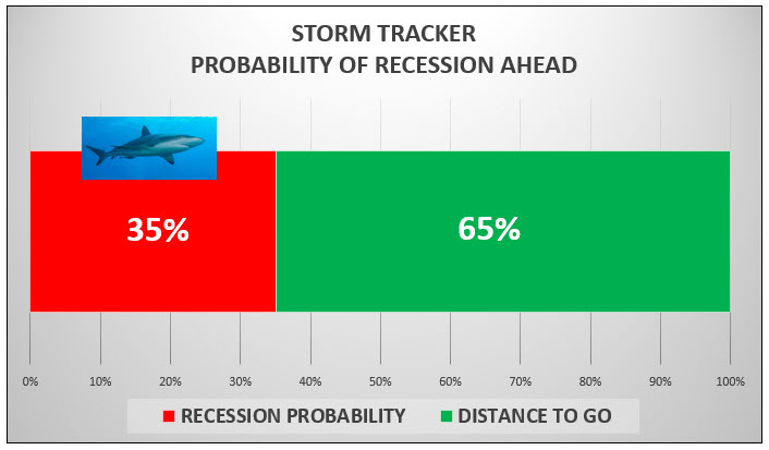
Many of you are already familiar with Storm Tracker, which lately has been hovering at 35%, which was our calculated probability that a next recession is off our bow.
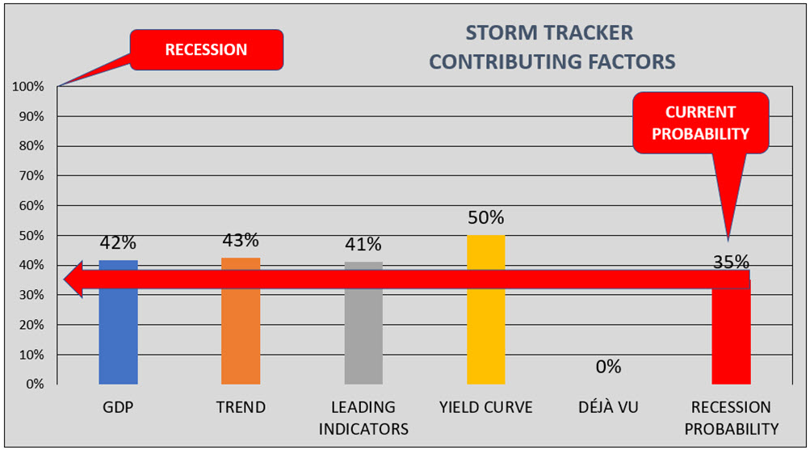
Storm Tracker is an invaluable component of a smart portfolio and tracks nearly 100 securities and indexes that include GDP, Trend, Leading Indicators, Yield Curves and our very own Déjà Vu, a trustworthy recession timing indicator.
As mentioned, recent probabilities for a recession were at 35% last week, tamed only by Déjà Vu’s 0% reading. Déjà vu was at zero because stocks had been holding up and interest rates had been falling.
That was the week before. But this last and horrible week, while interest rates continued to fall, stocks fell faster, closing up that Déjà Vu spread (between stocks and interest rates).
We urge those of you that have already subscribed to Signals Matter.com to look at Monday’s Storm Tracker for changes that could impact your smart portfolio, for as you know, Storm Tracker informs of the cash you should have on hand.
When Storm Tracker was at 35%, your cash should have been at 35%. It’s that simple. To better understand Storm Tracker in a smart portfolio, click here to Download Our 5-Part Series on Storm Tracker.
Signals Matter’s Storm Tracker is now available to Signals Matter Subscribers Only.
6 – Déjà Vu
Recessions are cyclical and have historically been preceded by extreme highs in equities and the extreme lows of flat or inverted yield curves.
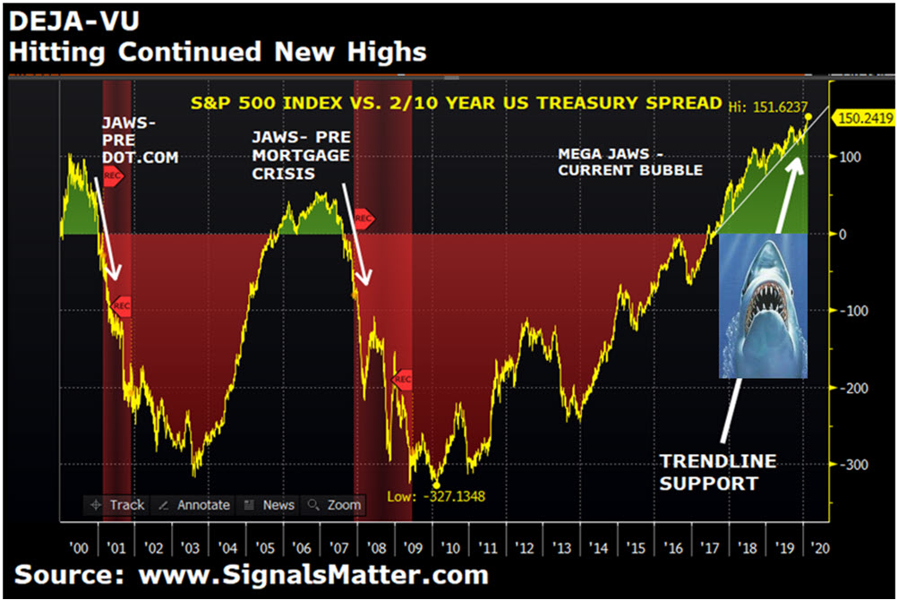
As many of you know, we track the spread between equities and yields to inform on the timing of a next recession, a model we call “Déjà Vu”, French for “we’ve seen this movie before” (2000, 2008 or even 1929…) as illustrated by the prior recessions highlighted in those red columns below.
Each prior recession was foreseen when the “jaws” of the spread went from “wide open” to closed shut—a bite that really hurts… and is fully consumated when yields rise and stocks fall—which happens when stocks and bonds fall together.
For now, we expect the Fed to keep yields from falling, so the “bite” is postponed for now, but by no means free of danger. A smart portfolio prepares for such events.
Despite low GDP growth, contracting global manufacturing, new threats of yield curve inversion and the spread of the Coronavirus, Déjà Vu (our trusty ‘canary in the coal mine’ for a next recession) continues to be elevated, putting time on our side.
That’s because stocks (the top half the open “jaws”) had remained elevated as yields (the lower half of the “jaws”) have dropped (as bonds have risen) in a perceived “flight-to-quality” (i.e. losing money from the moment purchased), widening the spread of those “jaws.”
Of course, the wider the Déjà Vu spread, the harder equites will fall when the “jaws” slam shut (as stocks fall and yields rise) and the next recession kicks in. We are not there yet, but a smart portfolio stays prepared rather than surprised.
When Déjà Vu breaks that thin resistance line in the upper, right-hand part of the chart below, all bets are off.
The jaws will be biting hard…That will be a truly informative event in a smart portfolio, for Storm Tracker recession probabilities will rise like a dorsal fin from the deep. But for now, repressed yields and likely more Fed rate cuts ahead will keep the shark at bay…
If you are already a Subscriber at www.SignalMatter.com, click on the What’s Ahead dropdown on the Subscriber Portal to see if Déjà Vu, Storm Tacker and therefore cash positioning and portfolio picks may have changed come Monday.
Signals Matter’s Déjà Vu is now available to Signals Matter Subscribers Only.
7 – Portfolio Suggestions
A smart portfolio needs to adapt with changing markets. Right now, there is a fundamental need to be smartly diversified—that is, to be in uncorrelated rather than correlated assets—aka avoiding “deworsification” masquerading as “diversification.”
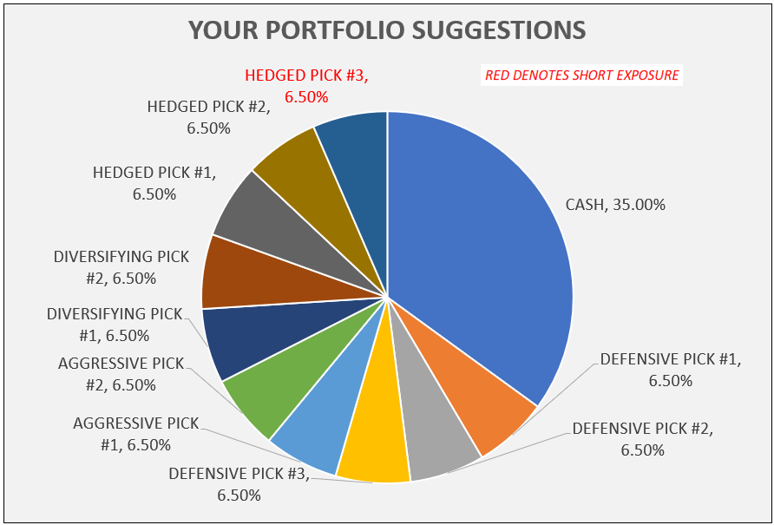
When it comes to building a smart portfolio, we believe investors should invest top down by choosing among cash, aggressive allocations, diversifying allocations and allocations to sectors and securities that provide an outright hedge.
We call this an All-Weather Portfolio, discussed in detail in The All-Weather Portfolio at Signals Matter. If you care about your money in an informed manner, you really need to read that report.
Here’s what our suggested smart portfolio (broadly) looked like last week, with respect to cash, aggression, diversification and hedges. (Regrettably, to protect our Signals Matter Subscribers, we are unable to disclose individual securities suggested.)
During that brutal week, the smart portfolio below enjoyed a gain of +0.98% (with cash allocated at 35%) and a gain of 2.00% without cash, both compared to a loss for the S&P 500 Index of -13%. Past performance, as we know, is not indicative of futures results.
Needless to say, our subscribers were not being eaten alive this week like the vast majority of investors.
If a smart portfolio heavily-laden with a 35% cash allocation can beat (and I mean crush) the S&P 500 Index, that’s what we call an All-Weather Portfolio—or just a smart portfolio… We love it, and think you will too.
Signals Matter Portfolios Suggestions are now available to Signals Matter Subscribers Only.
Summing Up
Summing up, global heat maps, timely charts, watching markets and sectors rotate, tracking storms and anticipating recessions are pre-requisites to developing an All-Weather, smart portfolio.
This is what we do. And we do it well by assembling all of these tools for easy application by Subscribers at Signals Matter.com. To be clear, that’s for Subscribers Only, and not for public consumption.
For subscribers, please click over to the back-end and review our smart portfolio recommendations going forward, all backed by the data, rather than opinions, which the market is sending us in real time.
Again, our aim is to not only tell you where to invest, but to SHOW you WHY. Not only is this a smart portfolio, it’s one backed by explanations and clear data so that you can “trust, but verify” for yourselves.
Take care, stay informed, and thus stay safe out there—it’s gonna be a bumpy ride.
Sincerely,
Matt (Macro Strategist) and Tom (Portfolio Strategist) @ SignalsMatter.com



I extend my deep appreciation to you both for the relevant and timely guidance regarding the percentage of cash to hold in my portfolio. After the dust settled this week, my loss in the retirement accounts was limited to 5.6%! Such sound financial wisdom! Thank you, many times over, for the Signals Matter service!