Earnings season is back and tech stocks are surging.
24 shares
Happy Monday, and as per our practice, let’s start the week with a deep dive into “What’s Happening Now” and what’s ahead in these admittedly interesting times.
Below, we examine current signals from the US tech sector and surging tech stocks, geopolitics, the earnings outlook, gold, the U.S. Dollar, China and even Tesla.
S&P 500 Index Too Tech Heavy?
The Technology Sector is looking a bit toppy to us this mid-January, as the charts below portray.
If you haven’t already noticed, the U.S. Nasdaq is trading through the roof, with two particular FAANG stocks–Alphabet Inc. and Apple Inc.–reaching new highs. We think Tesla is not far behind, and about to surge higher on hype, as it remains a company with no earnings or profits–but then again who needs earnings or profits in a Twilight Zone?
In melt-ups like this, seeing tech stocks soar is no surprise at all. Despite the fact that a closer look under the hood of the tech sector in general, or the clever tricks used by executives at Apple in particular, market tailwinds always favor tech first.
This, of course, is good for stock holders, but the fact that market cap of the FAANG tech stocks now comprises greater than 50% of the entire S&P 500, suggests it might be worth renaming the S&P 500 the “S&P 5” as this small handful of tech stocks is essentially becoming the market…
Be warned, however, as it’s a terribly bad sign to see so much market capitalization driven by such a small number of over-valued tech stocks which rise high together in artificial tailwinds yet tank together by greater than 30% or more in headwinds, as was the case in 2018-2019.
Despite tech’s current good news and surging tech stocks, we further caution that the Nasdaq is hovering in overbought territory…
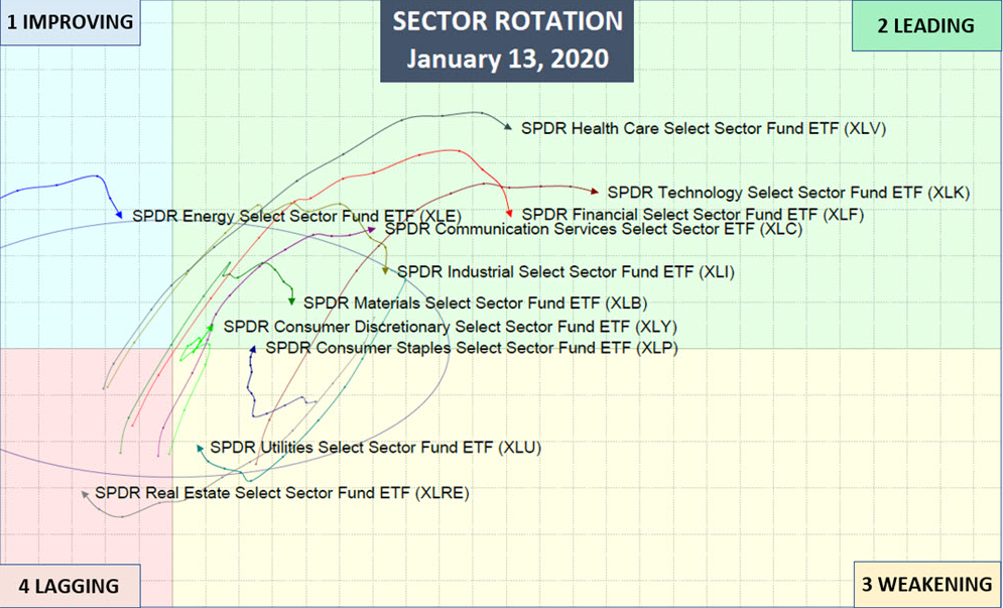
We’ve also been tracking the tech stocks in our Sector Rotation Chart, as other Sector ETF’s begin to roll over. For now, tech stocks are holding up the best among Sectors, but fair warning … caution ahead.
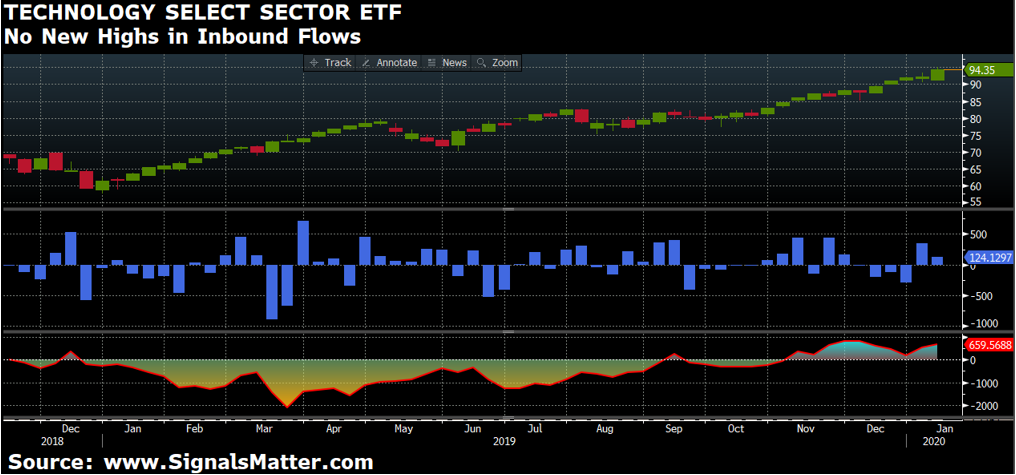
Finally, we would add this chart, revealing no new sustained highs in inbound investor flows into the tech stocks of the Technology Select Sector ETF (XLK).
 In other words, if
If you’ve been wildly profitable in this Sector, it wouldn’t be a bad idea to think about taking some profits off the table.
Again, these tech stocks can be your best friend in the tailwinds but your worst enemy in a headwind, so manage your risk levels accordingly.
The Geopolitical Seesaw
Despite early jitters, the U.S.-Iran conflict did little to move the volatility needle for stocks. Fear is largely out the door these days with a more than “accommodative” Fed keeping investors aiming towards record highs with an itchy trigger figure to go long equities.
In fact, I’ve written elsewhere how the winds of war are ironically tailwinds for the markets.
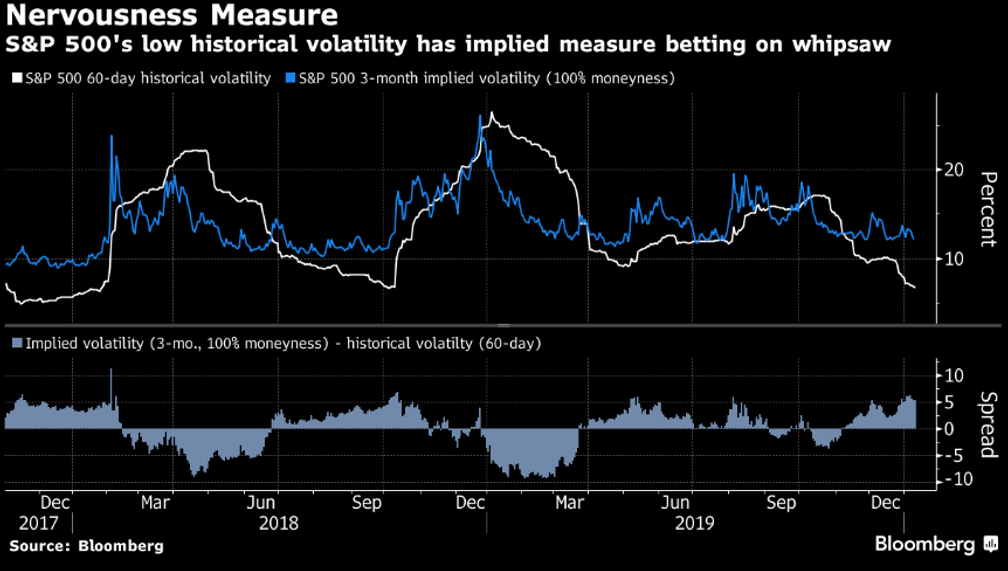
With the S&P 500’s 60-day historical volatility percentage below 7%, the trend chart below suggests better odds for a coming pop (i.e. dip South) occurring soon compared with other periods when volatility was higher.
In other words, the lower the volatility/fear, the more likely an “unpleasant shift” is looming months out.
The catalyst for that shift could very well be earnings season, which opens in earnest on Tuesday with results from Citigroup Inc. and JPMorgan Chase & Co., among others, soon to be making headlines.
We’ll be keeping our eyes on these for you, but recommend you keep one eye on your portfolio and the other eye on these earnings reports as they come out. That said, here’s what we know about the earnings outlook ahead…
Earnings Season—More About Tone than Facts of Overvaluation
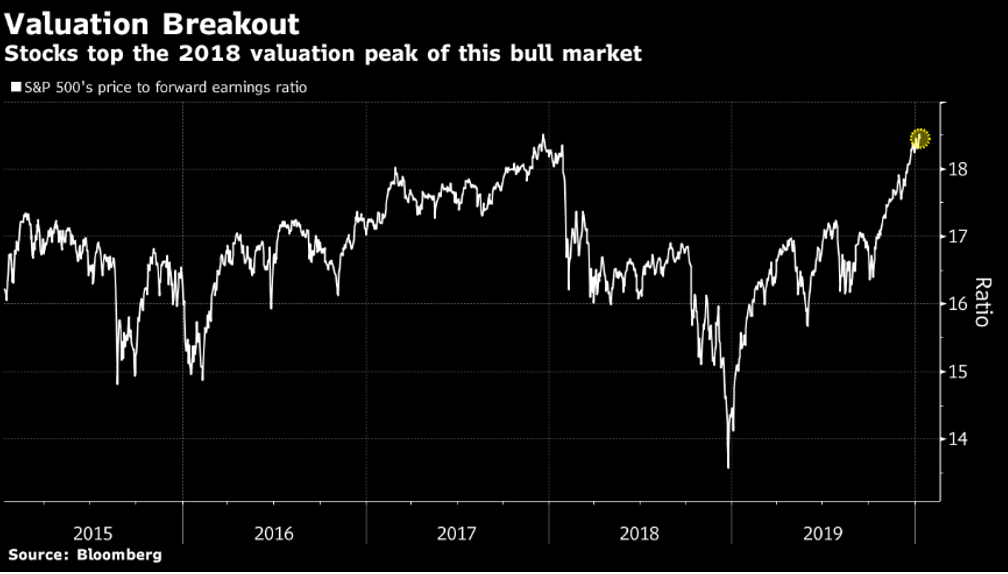
Currently, the S&P 500’s valuation highs have caused many bears to think of the 2018 market meltdown. That is, they see a similar pattern of highs portending similar lows thereafter.
But unlike 2018, we have a Fed printing money and lowering rates, not tightening money and raising rates, so I’m less bearish for now and don’t see an immediate 2018 comparison.
That said, corporate earnings are expected to fall for a second consecutive quarter as the reporting kicks in this week.
But who cares about such pesky little details like weak profits and earnings (already grossly distorted by Wall Street) when you have a central bank printing hundreds of billions and stapling the cost of debt to the floor in a grand effort to confuse an inflated market with a deflated real economy?
For now, as earnings fall, share prices will likely keep rising toward ever-new highs, especially among the tech stocks.
This disconnect between over-valuation (high prices) and weaker earnings should, of course, still be a concern to risk-focused investors. The S&P 500’s price-to-earnings multiple is now above the levels reached in early 2018, which ended the year by a drop of more than 10% in a matter of days.
But again, this year is different because the Fed is now perpetually dovish rather than nervously hawkish—which means it’s not totally crazy (in this otherwise crazy Twilight Zone) to be bullish for now, even for broken balance sheet names like Tesla.
Nevertheless, having rallied by more than 30% since last year, one can understandably wonder just how much juice is left for stocks in general and tech stocks in particular in the near term. Right now, stocks are trading at valuations not seen since the internet bubble of 2000, and we all know how that ended…
Nevertheless, the folks at Goldman Sachs Group Inc., a bank we know all too well, are not too concerned. But then again, Goldman can’t afford to look too concerned or it loses client fees…
The bank’s chief strategist, David Kostin, says it’s too early to worry, because the S&P’s current P/E ratio of 19 is well below the multiple of 23 at the peak of the internet bubble, which is a lot like saying as stupid as these valuations may be today, they’ve been even stupider before, so why worry?
For now, I actually concur with Goldman, but for different reasons. The recent Melt-Up we called is based primarily on Fed support not earnings or company balance sheets. For us, it’s just that absurd as well as that simple.
Even Bank of America’s Michael Hartnett foresees a potential for further rallies in tech stocks, and he’s actually one of the more candid and courageously bearish among his banking peers.
Like us, Hartnett feels stocks will continue to rise until the S&P’s P/E ratio hits 20. In the meantime, he is tracking signals from high-yield bonds, chipmakers, homebuilders and financial (banking) shares as possible warning signs for an end to this melt-up, as these indicators tend to flash red at a market top.
Overall, and despite stagnate economic growth, Wall Street sees more highs and rebounds ahead, and will even help push the psychology of hope to keep this going despite falling earnings and an entire cadre of declining fundamentals.
The number one trick Wall Street will use to ignore such current bad news is to emphasize something called “revisions to guidance,” which is just a fancy way of making projections that tomorrow will be better than today.
Such tricks of tone over substance may not be sincere, but they work nevertheless to keep investors calm and carrying on, and in a melt-up where hope replaces reason, and projections replace facts, we might as well ride this wave of crazy while we can—but always with a cash hedge and eye on our Storm Tracker indicators.
What’s Happening with Gold
Things are getting a bit more complicated in the gold market. Bullion futures swung between gains and losses Friday as traders assessed a report showing slower-than-expected U.S. hiring against an unemployment rate that stayed at a half-century low.
This kind of bad news, is good news for gold.
Thus, the jobs figures could help reinvigorate the rally in gold, which stalled last week as safe-haven demand for the precious metal cooled amid easing concerns over the economic-growth outlook and signs that the U.S. and Iran were stepping back from a deeper military conflict.
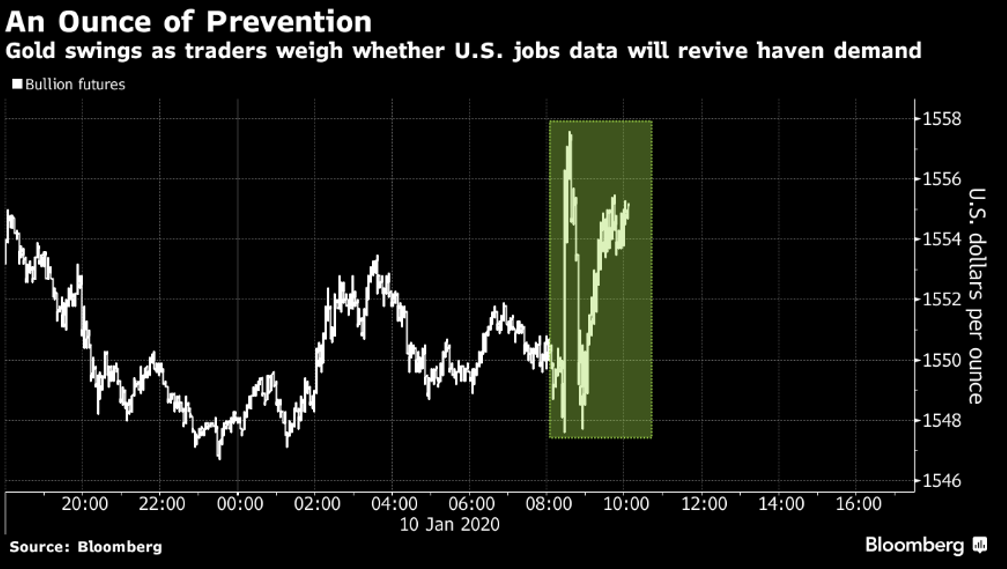
In short, there’s a seesaw in gold outlooks for the near-term, but as most of our subscribers know by now, our gold reports here and here underscore our view that gold should be held primarily as long-term insurance rather than traded daily or obsessing over price and sentiment fluctuations.
China’s Internal Woes and Current Highs
The yield spread between China’s 10-year and one-year government bonds is near the widest since April, after short-term bonds rallied in price on ample central bank liquidity, thus sending yields (which move inverse to price) lower on China’s short-term bonds.
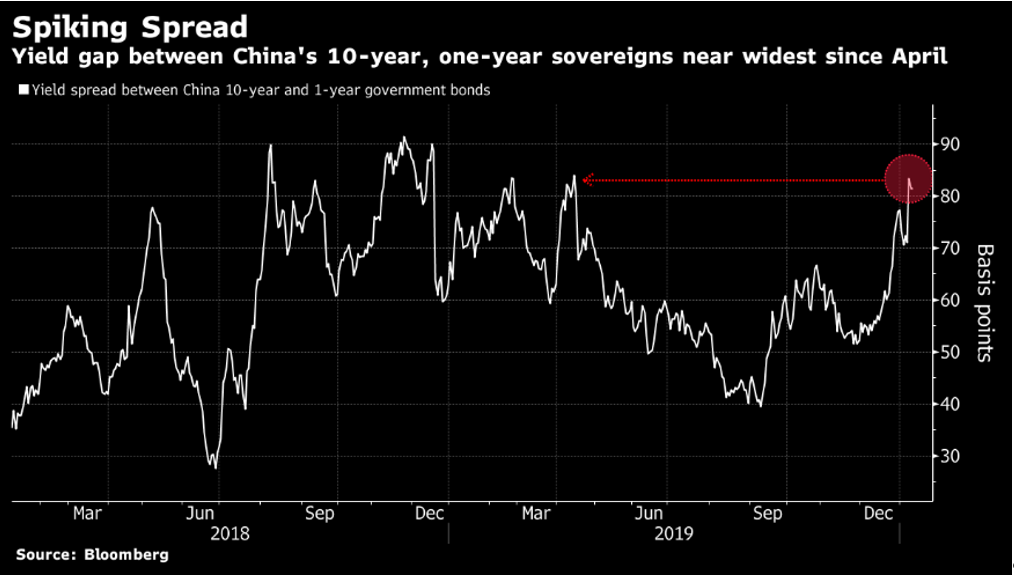
The yield of one-year debt in China is close to its lowest (as prices rise) in more than three years thanks to multiple cash injections by the Chinese central bank over the past month.
In other words, the Chinese central bank, just like the Fed, is no stranger to buying its own financial assets to keep the debt market price bubble alive on fake rather than actual demand.
Longer-term bonds, however, have been in less demand due to looming local-government debt sales (pushing down prices) and a return of risk appetite for stocks (and hence flows out of longer-term bonds) amid headline optimism over the Chinese economy and easing Sino-U.S. trade tensions.
Our take on this will come as no surprise. Central banks are powerful and can easily can-kick reality (i.e. cancerous debt rotting China from within) down the road, but in doing so, these central banks only create (and postpone) larger, systemic problems down the road.
You see, as prices fall and yields/rates rise in the Chinese Ponzi Scheme, the cost of debt rises as well, which explains the current and massive default rates in China’s non-government, corporate bonds.
Look familiar?
China, like the US, confuses an over “stimulated” market with a strong economy.
With 800 million Chinese living below the poverty level and private defaults soaring there, it goes without saying that despite propaganda to the contrary, the real Chinese economy is on thin ice while its central-bank supported markets reach higher.
In China, as in the US, when longer term rates (driven by broken markets rather than punch-drunk central bank support) rise, the real economy tanks, as debt simply becomes too expensive and enterprises fail in concert.
In China, as in the US, keep your eyes on those longer-term bond yields to track the risk ahead. Once they spike, things get ugly real fast, which is why the central banks there and elsewhere are printing like mad.
The US Dollar
Having just recently reported on the forces behind the U.S. Dollar, you already know how carefully we track the critical forces behind the dollar’s relative rather than inherent (i.e. purchasing power) strength.
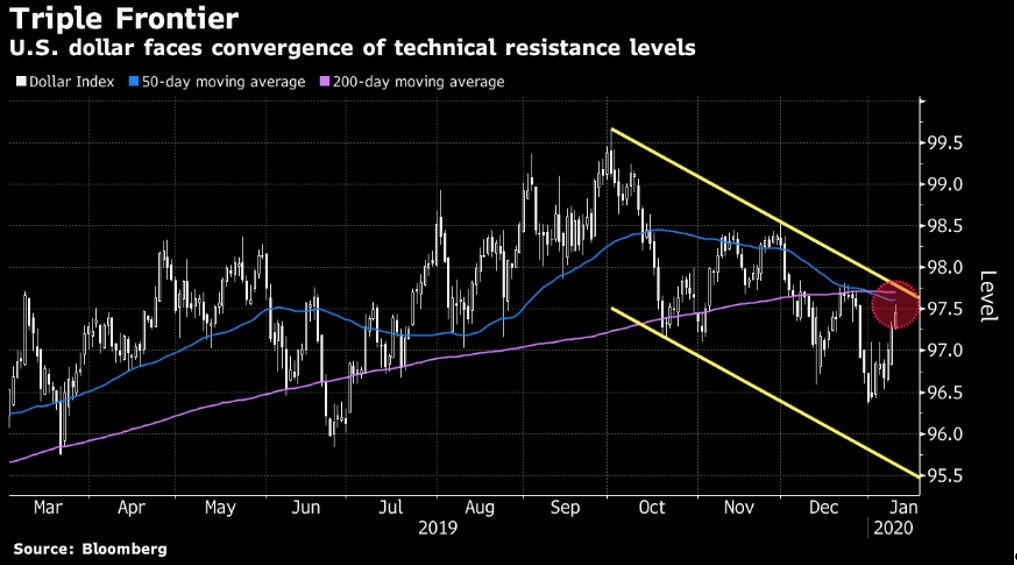
As of now, the Dollar Index has risen to test key technical resistance levels despite an over-all trend downward since the renewed money printing began in October – a force which worked to push/dilute the dollar’s strength.
The chart below tracks the dollar index’s 50 and 200-day moving average tops within the upper boundary of the downtrend it has been in since early October.
A break through the technical resistance (top line) would give ammunition to dollar bulls, while a failure would cement bearish views that the U.S. currency is set to weaken in the first part of 2020.
As always, we’ll watch the markets rather than the pundits for the signals, so stay tuned. Overall, however, the shortage of dollars around the globe is an absolutely essential signal that almost no one understands or sees to keep the dollar stronger than other currencies.
Tesla…
My longer-term views on Tesla as a broader metaphor of market distortion, dishonesty, unsustainability and hype are also well known to subscribers.
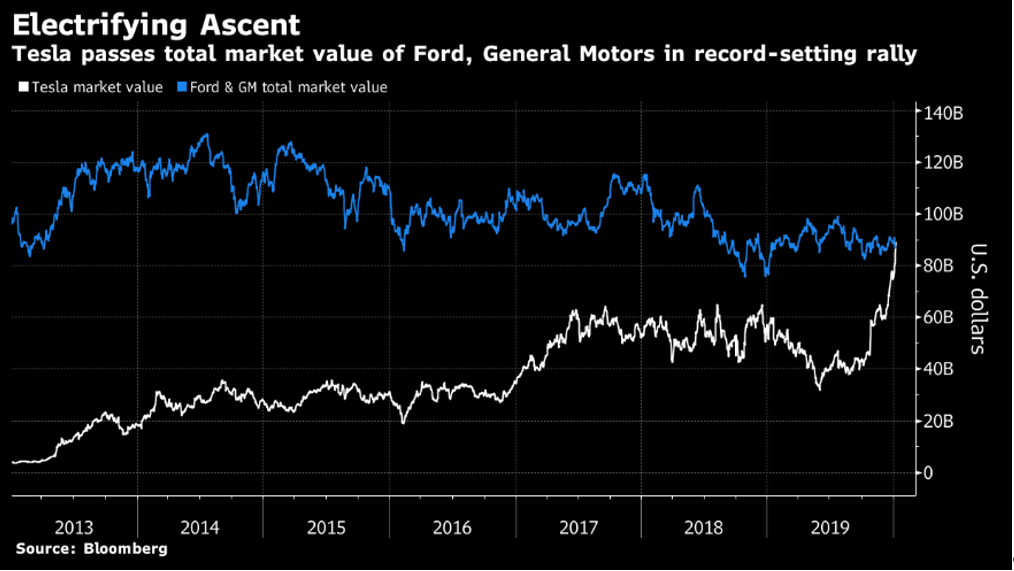
For now, however, Tesla Inc. just became more valuable to U.S. stock investors than Ford Motor Co. and General Motors Co. combined.
That, folks, is crazy, as the valuation is based on investor hope (pushing up share prices) rather than balance sheet reality—a classic sign of peaking market behavior.
The electric-car maker’s market value closed at $88.7 billion, surpassing an $86.2 billion combined total for Ford and GM, according to data compiled by Bloomberg.
In fact, Tesla’s value climbed by more than 175% since its June low as the company reported a surprise (and actual) third-quarter profit and began production from a new Chinese factory. I actually think Tesla can rise much, much higher in the near-term.
Obviously, I have to eat some crow for my continued distrust of Tesla, as its stock rally has sure been a boon for those of you tracking its trend or buying its stock. In sum: You certainly get the last laugh on me—for now at least…
That said, if you’ve been enjoying Tesla’s ride, now might be another good time to take some profits, as many analysts are rightfully downgrading their ratings on Tesla to neutral, as there is less room for Tesla to climb much further at these highs, an observation which Ray Dalio has made about the overall (and dangerous) “euphoria-and Fe-driven” stock surges in general.
That said, I think hype, spin and greed will send the stock higher, as this was the kind of crazy I got used to during the tech bubble of 2000.
Furthermore, Tesla is not for those with weak stomachs, as it is a stock which has a notorious history of rising big and then tanking even bigger thereafter. I know many who trade this volatile stock almost exclusively, as it gives constant windows to go long and then go short, over and over and over…
Meanwhile, Elon is looking for another piece of hype (having bombed on his latest non-breakable glass guarantee) to drive more folks into his uber-hyped stock, and is now promising to field a million fully autonomous “robotaxis” sometime in 2020.
I’m not holding my breath…Musk is clever, but mostly he’s a brand-marketing guru, not a management guru. In short, all hat, no cattle. That siad, if Elon is able to corner a big chunk of the Chinese auto market, Tesla might actually turn a profit down the road and become a real auto force rather than just a sexy headline for the tech stocks.
What to Watch
As for things to look for in the coming days, we recommend the following:
- Stock prices will dominate the economic schedule next week, which also brings the Jan. 15 signing at the White House of the phase-one trade agreement between the U.S. and China—a likely tailwind, big on optics despite very little substance.
- The New York Fed will release its new schedules on Jan. 14 for Treasury purchases and repo operations, which just means the Fed will keep printing money outside its original mandates to keep Wall Street greased at the expense of further debt down the road.
- Here’s the economic calendar:
- Jan. 13: Monthly budget statement
- Jan. 14: NFIB small business optimism; consumer price index; real average earnings
- Jan. 15: MBA mortgage applications; producer price index; Empire manufacturing; Fed’s Beige Book
- Jan. 16: Import/export prices; retail sales; Philadelphia Fed business outlook; jobless claims; Bloomberg consumer comfort; business inventories; NAHB housing market index; Treasury international capital flow data
- Jan. 17: Building permits; housing starts; capacity utilization; industrial production; University of Michigan sentiment; JOLTS job openings
- It’s a full slate of speeches by regional Fed presidents:
- Jan. 13: Boston Fed’s Eric Rosengren on the economic outlook; Atlanta Fed’s Raphael Bostic discusses economic outlook and monetary policy
- Jan. 14: New York Fed’s John Williams discusses behavioral science at a London event; Kansas City Fed’s Esther George on economic, monetary-policy outlook
- Jan. 15: Philadelphia Fed’s Patrick Harker on monetary-policy normalization; Dallas Fed’s Robert Kaplan addresses Economic Club of New York
- Jan. 17: Harker on the economic outlook
In short, there’s a lot going on, and lots of overlooked facts and ongoing projections. As usual, we’ll be tracking the market’s reactions/signals and keeping you informed.