
Market Crisis
Below, we look at the convergence of Quantitative Tightening, pending US Treasury debt expansion and a long-in-the-tooth business cycle all converging toward a perfect market storm as well as market opportunity, ahead.
Neither Bull nor Bear, Just Blunt
Here at Signals Matter, we have the luxury of speaking bluntly, having left institutional banks and funds and their compliance constraints so that we can speak of risk and opportunity, alas, without constraint.
In this way, we have earned a platform to be candid in our views of the markets, without shying away from our style of trading the markets. That is, we retained our instinct to make returns and are doing precisely that, well outperforming the markets by both risk-adjusted and absolute measures.
Despite our trading confidence, however, we have little to no confidence in the markets in which we trade. As any who follow our blogs on central banks, bond markets and macro views have (or will) discover, we are deeply concerned.
The empirical evidence gives us a sad but objective confidence that the financial markets are heading into a perfect market storm, the kind that will ruin most investors and create life-time opportunities for others.
Does this sound like fear-mongering? We hate that. Everyone hates a market bear, and we are no different. Markets require bullish confidence, and we want to share in this confidence. Furthermore, tax, spend and infrastructure policies aimed at helping our economy deserve our support, patience and optimism.
After all, one doesn’t cheer on the home team by throwing tomatoes at their starting pitcher.
In short, we never set out nor intend to remain “chicken littles” who take some perverse pleasure in smugly predicting a market catastrophe. Moreover, and as any veteran investor knows, predicting market crashes has little more merit than tarot cards.
No one can time a market correction perfectly, but anyone can plan for the obvious.
And that’s where we ethically have to turn: the obvious. The issues and numbers facing these markets are not the academic or personal opinions of stuffed shirts, they are simply the cold diagnosis of numbers which decades of trading have taught us how to interpret.
These numbers portend significant illness ahead.
Lighthouses and Fog
So, let’s simply pause, cut through the fog and focus on the lighthouse for a moment.
The lighthouse comes down to this: debt—there’s too much of it–$13T alone in US businesses, and $70T in combined sovereign, corporate and individual debt. These numbers have no precedent and are staggering. The pain ahead is historically and mathematically inevitable, full stop.
The fog comes down to this: markets are at all-time crazy highs; the S&P is trading at 25X PE’s (against at an annual earnings growth rate of only .3%), the Russell 2000 index is trading at 110X earnings, tech shares with little to no profits like AMZN are trading at 280X earnings, the business expansion cycle is now in its 103 month (the record is 118), and the Main Stream Financial Media tells us and the world that America is doing just fine.
So, let’s separate the fog from the light house and row toward empirical truth not media buzz or cognitive dissonance. Let’s face numbers, facts and cycles, not political views or favorite anchorman. Folks, this is the economy—our economy– we are talking about, not financial journalism. Let’s get real.
Fog is bad. It clouds our vision. When we look at the RUT trading at 110X multiples and hear the Fed telling us all is fine along side a cheerleading media, we forget market history and bury our worries about tomorrow in the sand.
That same RUT, for example, which climbed from 340 to 850 in October of 2002 gave it all back—and we mean every drop of it, by 2009. And the same Fed that assured you in 07 that a “great moderation” would prevent any further stress on the markets, was hugging its knees when the markets tanked only a year later.
I’ve written ad nauseum about the failures and patterns of the Fed in the past and the inevitable failures heading our way. I won’t repeat them here, but the links offered can more than remind you of the numbers we face rather than opinions I write.
A Market Bubble, Plain and Simple
By numbers rather than adjectives, we sit now upon the greatest central bank fueled bubble in the history of the markets. Nine years of ZIRP and QE have so distorted price discovery, risk management, volatility indicators and investor caution (all at historically low cash allocations of bullish greed) that the reckoning to come for this market hubris will alter capital markets in ways unthinkable.
Since the Fed “stimulated” America out of the post-08 rubble, the value of US equities in households has skyrocketed by $12.5T, yet like in the prior “stimulus” examples driven by the Fed, this growth came not from Main Street prosperity, but from Wall Street speculation aided by a Fed liquidity needle in the market securities arm.
But markets, like people, who rely on drugs to perform, are simply dead men walking. When the needle gets dirty or the drugs run out, the beneficiary of that twisted stimulus collapses. Remember: everything we are enjoying in these inflated markets is Fed-based, not growth based.
Running Out of Steroids?
And what makes today’s bubble so scary is that the monetary drugs employed by this Fed-based “recovery” are about to run out. The historical pivot the Fed is desperately taking from Quantitative Easing to Quantitative Tightening is the unspoken skunk in the woodpile.
As written elsewhere, the Fed intends to shrink its balance sheet (i.e. steroid stash) at an annual rate of $600B. That’s a lot of withdrawal symptoms, and it keeps getting worse. At the same time the Fed “tapers,” the US Treasury will be dumping US bonds into the market to the tune of $2T in FY 2019.
Folks when you add more debt into the bond market, credit prices drop and credit yields (and hence interest rates) shoot up. By the way, by the time Quantitative Tightening collides with Fed “run-off” and more US debt issuance, the US will be past 123 months of business expansion, the longest in recorded history.
In short, we are and will be very late in an already stretched business cycle when the bond market pulls the noose around this everything bubble. Remember: it all comes down to debt. Our bond market is the ticking time bomb, not bitcoin speculation or FANG fantasy.
When yields spike and the cost of borrowing cripples an already over-its-skis business sector, markets will fall like the cards upon which they were built. This is not opinion, it’s the gravitational law of debt, of which I’ve written elsewhere, and of which von Mises humbly warned generations of debt-driven bubble makers: the bigger the debt bubble, the bigger the catastrophe that follows.
Again: it’s hard to see catastrophe when drunk on bubbles. We are not here to scare or rant, we just want you to see the bubbles. Period.
Political Solutions?
Sadly, the very elected officials, red, blue or paisley, who we hope to save us do not see this bubble either. They are, after all, politicians, not fiscal sages.
The much heralded but largely yawning tax reform bill and budget forecasts on the Hill are assuming $30T of extra GDP over the next 10 years, which is a delusional growth projection 23% greater than the last decade’s growth rate, the same decade in which we were high as kite on Fed steroids that are already losing their punch.
To make such a growth forecast with a straight face is akin to me promising to start for the Yankees in the spring.
In short, the solution we are being given to handle the converging perfect market storm ahead of monetary tightening, increased US Treasury/Debt issuance and a geriatric business cycle is the declaration that magical growth will take us there on the back of a 200+ month growth cycle that no economy in the history of the world has ever seen.
Really?
Yes. Really. That’s the “plan.”
This, we all know: is dishonest. It’s insulting to market knowledge and business cycle facts—similar to expecting a 90-year-old man to beat his high school record in the 100-yard dash.
How can a country and market in the backdrop of record-breaking debt achieve record-breaking growth?
What Do You Do?
So, what do you do? Run for the hills? Empty your trading accounts? Go to cash?
Here at Signals Matter, we recognize that each of us must measure risk and uncertainty based on our own signals, experience and tolerance.
Our trade signals as well as our Recession Watch and Trend Watches give us and our subscribers the tools to make a plan, not a timing bet. We don’t seek crisis, but we know how to profit from them, for there is great opportunity now and ahead to turn market crisis into market opportunity.
Today, we are agnostic as to how long this bull keeps panting, for bull or bear, our signals and indicators offer long and short data rather than just sobering blogs to manage risk rather than fantasy. These blogs are meant to inform each of you of the bigger picture. As to how you interpret or invest around it is entirely your decision.
If, however, you seek candor and a plan, we are here to help.
In the interim, let’s close with a reminder that what we are told versus what is in fact true when it comes to our “great recovery.” We know this recovery is empirically more form than substance. I wrote recently about the sad divide in America between Wall Street and Main Street. I’ll close with an image to let this sink in.
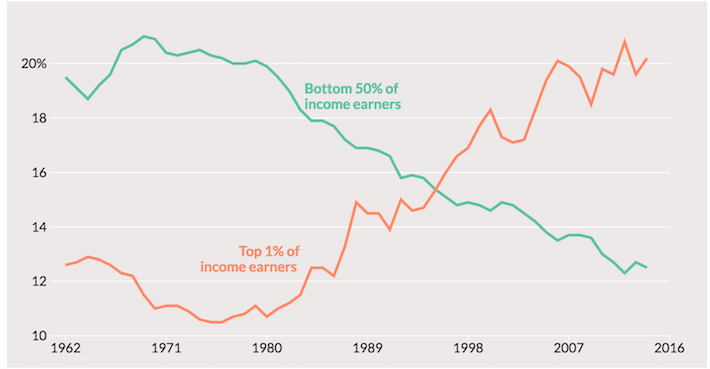
When pundits cheer this booming economy, remember they are cheering a booming market, not America. In the chart below, the green line tracks the income stream of the bottom 50% of American households whereas the Orange line tracks the top 1%.
Like many of you, I’ve been blessed with years of financial highs as well as hardships. I believe in America and am a product of its dream. But when I see trends and disparities like this below, I don’t feel at all like this is America at its best. You?