Recessionary fears are abating for now–what should you do?
27 shares
In the last two weeks, market winds have been changing dramatically in both direction and speed – which is typical in a Fed-driven Twilight Zone.
In such muted, back-and-forth markets, the signals get confused and it’s easy to feel frustrated.
Markets can move to all-time highs on headlines or more “stimulus” rather than core fundamentals and reality.
Recently, trends and risks to the downside have ostensibly slowed down, as have recessionary fearsthough markets opened lower today. The Fed has been a busy bee, bailing out the short-term treasury and repo markets, printing billions and cutting rates in just the last 30 days.
The recent ride up on more QE was a fat, easy pitch, and I made this as blunt as I could here.
In addition to Fed “accommodation,” headlines are smiling bullish as trade tensions between the U.S. and China appear to be easing, with a Phase 1 resolution on the table.
And despite the fact that Brexit is a divorce, the press is emphasizing signs of a happy divorce (?), albeit with further delay, reducing near-term fears of a hard exit (despite Moody’s recent downgrade of the U.K. sovereign credit score to the negative column).
That’s the good news, and our Storm Tracker has turned technically less bearish for the near-term.
Meanwhile, the higher-level bad news (record-breaking debt, Fed desperation, Main Street polarization, and political warfare) remains in place, but is temporarily no match for headline confidence and an “accommodative” Fed and thus a fall in recessionary fears.
Again, these larger and frankly appalling realities are not opinions, but simply empirical facts, including…
- Tumbling GDP;
- Increasing cracks in U.S. consumer spending (a sole-surviving pillar of growth in the U.S.);
- And decelerating wage growth (not good for peak-debt consumers otherwise eager to spend).
Facts are facts. We stick to them, despite falling recessionary fears .
So, buckle up…
It’s All About Growth
Growth is the key to keeping the lights on, but even the Fed is admitting to darkness.
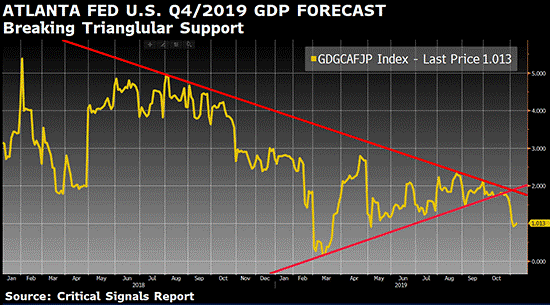
Our very own Atlanta Federal Reserve, respected for its GDPNOW forecasting, has pegged Q4 growth to an embarrassing 1.0%, knocking it below triangular support as shown below.

That yellow growth line is now significantly below the 1.6% pace needed to achieve the Fed’s 2019 growth forecast.
In short, and despite 11+ years of trillions and trillions of “stimulus,” the real economy (as measured by GDP) is tanking because all of the Fed’s “accommodation” has gone straight past Main Street and directly toward Wall Street and grossly inflated stock valuations that operate to somehow quell recessionary fears.
A 1% GDP forecast in the backdrop of nearly $4 trillion in post-’08 money printing and zero-bound interest rates is simply, well, sickening. Recessionary fears may not come from the markets, but from the real economy.
Sea Anchors
Today, a host of sea anchors are slowing down natural U.S. growth, namely…
- Small business hiring and manufacturing hours are in decline across all sizes of firms;
- Prices for finished goods are decelerating, depressed by a strong U.S. dollar;
- A slowdown in income growth is weighing on the retail sector;
- And U.S./China and global uncertainty are still pressuring capital expenditures, as supply chain disruptions are here to stay, regardless of what “resolution” we see with China.
In short, and despite recent headlines, the damage has been done. And yet markets recently hit new highs with lowered recessionary fears…
And the crazy continues.
China, which struggles with truth and ethics, nevertheless accounts for 40% of global GDP, and it’s slowing, too. Never a good thing.
To keep the export light on in what has become a prolonged trade war, China has been stealthily cutting prices for buyers around the world, while competitively weakening its currency to boot.
China’s slow growth is taking a toll globally, forcing everyone else to similarly compete, cut, and deflate.
Think of it as one big race to the bottom, for there is little choice when demand slumps – price deflation kicks in.
No wonder the U.S. Fed and other central banks are so publicly desperate to kindle some “target inflation” to help manufacturers make a buck – but it’s just not happening.
The truth is, the Fed fears (rather than “targets”) inflation, and we’ve explained this almost comical conundrum (and lie…) in detail here.
But the condensed version boils down to this: Inflation means higher rates, and higher rates (borrowing costs) kill debt-driven growth. Debt-driven growth, however, is the very name of our game, and thus inflation and rising rates end that game. Period. Full stop.
The Fed is thus saying one thing (“target inflation”) yet fearing (and hence manipulating) another thing (honest inflation).
More confusion, less candor. Alas, more Twilight Zone…
Interest Rates and Bond Markets: What They Tell Us
As I’ve said many times, “the bond market is the thing.”
So, let’s get boring for a second and see what it’s telling us.
All the renewed optimism above has left short-term U.S. Treasury yields on the precipice of a big move in either direction, according to Citigroup.
Remember, bond yields move inversely to bond price, and bond prices go up in periods of angst and down in periods of hope.
Recently, we’ve had moments of both.
If stock fears fall, so do bond prices, which means yields rise as investors exit bonds for more stocks. But if fear rises, so do bond prices, which means yields fall.
So, what can we expect near-term when it comes to short-duration bonds? A soft landing of rising yields or a hard landing of falling yields?
Well, the “experts” like Citigroup can’t decide, but they see short-term rates moving big either up or down. Which means they don’t frankly know – more Twilight Zone.
As for us, we see yields on the short-term bonds going down, for the simple reason that the Fed is printing billions to buy them–so prices rise and yields fall.
The directional forecast for longer-dated bonds like the all-important 10-Year U.S. Treasury is different yet equally clear.
Yields/rates for longer-dated bonds are starting to rise as more confident investors leave the “safety” of longer-term bonds (and gold) for the fun of stock speculating.
Furthermore, the Fed is currently not buying the 10-Year bonds, so down they go in price and up goes their yields and rates…
Again, I told you this would happen a few weeks ago right here.
No psychic skills were needed. The Fed was buying short-term bonds, not longer-term bonds, so it was fairly clear which bonds would go up and which would go down in price.
The Fed, after all, is THE market today. For many, confidence in this Fed reduces recessionary fears.
In the chart below, the 10-year yield has thus broken former resistance (in red) and is now moving slowly to the upside as 10-year bond prices move slowly to the downside.
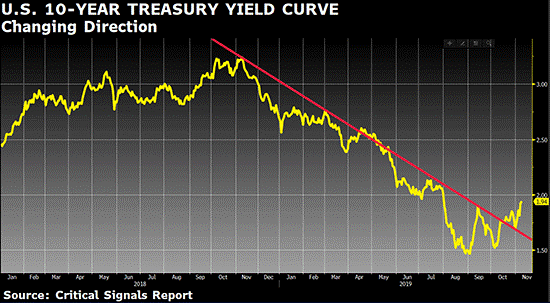
This is good news for markets hitherto worried about an inverting yield curve, so hooray for that and hooray for now.
How did this yield curve recover so quickly?
Uncle Fed pulled off a hat trick, a trifecta.
- It reduced short-term rates;
- It went back to buying our own short-term Treasury bills (thus artificially lowering yields at the short end of the curve);
- And it flooded the liquidity-starved repo markets with billions of dollars.
Investors are thus sighing in relief thanks to more near-term “intervention.” As I said here, the Fed may be running out of bullets, but for now, those bullets still have some punch left in them.
Stocks, of course, predictably began to rise again as interest in long term bonds (and the fear they represent) declined – again thanks entirely to an “accommodative” Fed and rising stock prices.
A Safe Fix?
Normally, rising yields on the 10-Year Treasury suggest fear is out and growth and confidence are in, but the data we showed in the opening paragraphs confirms that there is factually no such growth, despite declining recessionary fears.
If so, then why are 10-year rates/yields rising (and hence bullish investors leaving bonds) in a world of declining growth?
Simple: The Fed’s money printers and short-term Treasury suppressors just handed the stock markets more cheap debt and hence more can-kicking fun.
Once again, stocks are in vogue on Fed support rather than natural market growth, plain and simple. Economic fundamentals, sound balance sheets, or healthy indicators regarding real recessionary fears thus have NOTHING to do with price action.
Furthermore, the world’s other central banks are playing with the same steroids and have been doing so for over 11 years since the Great Recession. Party on!
So yep, we may be in that stock melt-up we anticipated – one that can last longer than otherwise balance sheet-focused traders can honestly/safely short a Fed-doped market. But as we warned, never fight the Fed.
Instead, just be patient and don’t get too complacent or seduced by falling recessionary fears.
Not So Safe
In other words, be long-term wary of all these bullish headlines and moves.
Why?
Because the markets are telling us so. They will rise like rockets for awhile, and then hurt you.
The last time yield curves (the green line below) started to slowly rise after a slew of Fed rate cuts (think 2007), global stock markets (the orange line below) collapsed (think 2008) once the yields on the 10-year Treasuries (i.e. cost of borrowing) got even an inch too high.
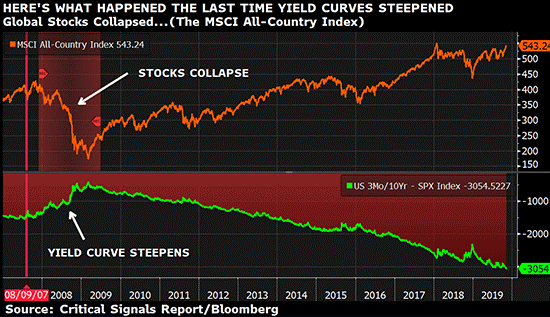
Only this time, it’s worse. Yields are creeping up against much greater debt levels.
Corporations are tapped out. They have piled on mountains of corporate debt since 2008 (to buy back stocks and pay dividends rather than do something productive) and are not going to like higher interest rates creeping up. They just aren’t.
Why worry? Well, as I said here, artificially coiled/repressed rates eventually go from creeping up to springing up, and that’s a moment of “uh oh” in the making.
For now, however, “all is quiet on the market front.” Recessionary fears are muted. In fact, we see a significant market rise heading into 2020.
But down the road, we’re doomed either way. Market bombs will fly, as the Fed, like the brainless generals of the First World War, has created an absurd scenario in which nothing they do can save them.
If they lower short-term rates (artificially), the yield curve slowly recovers and thus cheap debt sends the stock markets back up. But in such a scenario, stock-chasing investors leave longer-dated bonds to buy overvalued stocks, and in so doing send longer-dated bond prices down and hence their rates/yields up.
And as 10-year bond yields rise, borrowing costs rise, which means those record-high debt-soaked companies will see earnings (and thus stock prices) fall in tow.
And that, folks, is what a Fed-rigged Twilight Zone is all about.
There is no easy way out of the “no man’s land” they’ve created, at least not without natural rather than Fed-engineered growth, for not even the U.S. Fed can put growth on a national credit card forever…
And natural growth, as we’ve seen, is all but gone. Don’t just take my word for it, simply look again at the GDP data… It’s appallingly low…
Revisiting Déjà Vu
Remember Déjà Vu – the jaw-like spread we’ve been tracking between interest rates and the S&P 500 Index?
It’s a complex “spread on a spread” tool and is about as fun to read as a lawnmower manual, but trust me – it’s a very important indicator, so bear with us.
When bonds and stocks rise together, yields (the lower jaw) coil down as stock prices (the upper jaw) go up – which means the spread (or “jaws”) preceding a sell-off start to widen.
And the wider the jaws get, the harder the “bite” becomes when the jaws eventually close.
And what makes the jaws close? The answer is simple: They close when yields (yellow) rise and then stocks (red) fall. In such a scenario, bonds and stocks are no longer rising together, but falling together.
And that folks, is precisely what we’re tracking in the MSCI chart immediately above.
See how those jaws had been widening as the rising stock market (top red line) went up and falling bond yields (the bottom yellow line) went down?
But drum roll the Jaws theme song. Something is coming from beneath the surface… the jaws are slowly closing.
As in the chart below, whenever we see lots of green peaks (i.e. widening jaws) at the top of a market cycle, a massive fall-off in stocks (the yellow line below) always follows.
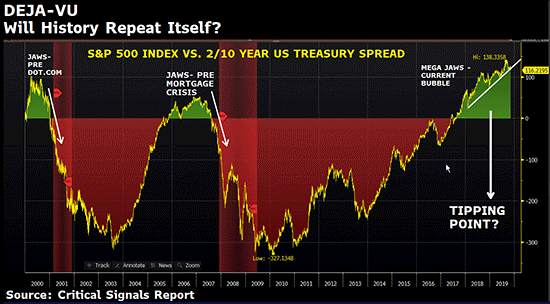
As of right now, that yellow line stock market is peaking at the very same time the green “jaws” (upper right above) are at their widest ever – which is fun for a short time, but deadly when the “jaws” close, the green vanishes, and the once-rising stock market cascades straight to the floor…
Again, those jaws will clamp shut when yields rise. They haven’t yet – which is why we track them. And don’t worry, we’ll tell you ahead of time when to get out of the water.
For now, it’s still somewhat “safe” to swim in stocks, but the shark is slowly approaching, because longer-term yields are slowly rising as the price of longer-term bonds is slowly falling – which is why we still don’t recommend swimming naked – that is “all in.”
Our recommended cash allocation is a key way to manage these empirical risks.
But I’ll repeat: It’s still early, and yields are not dangerously peaking – yet.
But as yields on the longer-dated Treasuries continue their slow rise, you can expect this spread (jaws) to eventually shut, and with it, a fatal bite in the equity markets.
We just can’t over-emphasize enough how important it is to track the yield on the U.S. 10-year Treasury and its relation to the stock markets.
It’s what keeps facts guiding our investments rather than just bull vs. bear opinions or clever articles.
Remember, we are traders first, commentators second… And every street-tested trader knows that the bond market is the key indicator for what happens in the stock market.
Sadly, almost no retail investors get this. But now, YOU do.
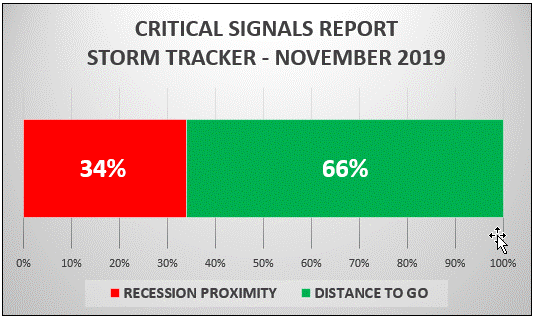
Storm Tracker
So, where is Storm Tracker in all of this?
As you might expect, Storm Tracker is less scary in the near-term thanks to…
- The recent Fed stimulus;
- Improving trade & Brexit headlines;
- And a re-steepening yield curve.
Does this mean you should pile back into equities and reduce that cash position from the mid-40s to the mid-30s?
Nope. Not yet.
Facts are still facts, and facts drive Storm Tracker. Yield curves, for example, comprise 20% of Storm Tracker, so we’re not surprised to see a fall in the wind speed of our recession tracker.
The Fed has indeed bought the markets more time and pushed off some immediate recession concerns…
But we are nevertheless alarmed by the fact that the Storm Tracker has fallen so fast, the yield curve has steepened so fast, and so much stimulus has recently been added so fast.
Rates/yields on longer-dated bonds that continue to rise at this pace could wreak havoc in the months to come. Safe today is still far better than sorry tomorrow.
Some of you, however, may choose to go a bit deeper into stocks based on this revised Storm Tracker percentage (i.e. less red danger), but don’t get too bold.
Keep a Lookout on the U.S. 10-Year
Again, in a debt-driven and totally rigged-to-fail market high, everything now hinges on the cost of that debt, which means everything now hinges on rising rates.
Nothing tracks this better than the yield on the 10-year U.S. Treasury. If it rises too fast, rates rise along with it, which means the party ends when they get too high.
Your Questions
Some of our readers rightly noted that our recent Fed Red Day wasn’t very red.
That is, the markets didn’t close noticeably down on the “good news” of a rate cut. This, coupled with October’s renewed money printing, suggests that the Fed’s steroids still have some punch, which means stocks to do.
Again, the Fed IS the market… That’s why it’s critical we track market reactions to Fed “stimulus,” for the day will come when markets stop rising on Fed steroids.
Weeks back, while fly fishing at Sundance, I let you know that renewed money printing meant a rising market. Easy peasy. Since that video/article, the S&P 500 Index has gained 3.6%.
I know it can be extremely frustrating to read me rant about empirically broken, rigged markets and all the embedded risk in them, yet see markets going up, up, and up to record highs.
We share this awe and disgust, but have also given many signals to buy bullish trends when the Fed hands us a fat pitch, including here.
That said, we still recommend healthy cash allocations, even when markets are giving clear buy signals.
Why?
It’s simple: We only go all-in at bottoms, not risk-saturated tops. More on this here.
For now, we fully respect the frustration – we share it.
But we equally respect patience, which is admittedly easier said than done when markets rise on Fed steroids despite clearly broken macro fundamentals.
That said, a bottom is coming – and no one can say when, at least not until the markets tell us so, and it’s the yield on that 10-year Treasury that will speak the loudest.
Until then, stay calm, stay patient, stay with your common sense, and stay informed.
Sincerely,
Matt Piepenburg
Comments
4 responses to “Recessionary Wind Speed Slows: Is it Safe to Go Back in the Water?”
- B. WARRENsays:
ITS NOT INFLATION, ITS CURRENCY DEPRECIATION. WE WILL CRASH IF THE BOND MARKETS FREEZE UP AND THE FED CANT UNFREEZE. HOWEVER, THERE IS BASICALLY NO PURCHASING POWER LEFT IN THE DOLLAR NOW. THE SO CALLED FED AND THE FRACTIONAL RESERVE BANKING SYSTEM HAS CREATED, AND IS CREATING SO MUCH MONEY THAT AT SOME POINT NO ONE WILL ACCEPT THE DOLLARS ANYMORE. THAT WOULD BE CHECK AND MATE AS WELL. CAN YOU THINK WEIMAR REPUBLIC? WE CAN SIT, DRINK COFFEE, AND PONDER ARCANE FINANCIAL CONCEPTS WHICH IS ALL WELL AND GOOD, BUT MAKE NO MISTAKE ABOUT IT ——-ONE WAY OR THE OTHER WE ARE GOING TO CRASH.———
DBW
- Pete Wehrsays:
Again you are spot on ! Thanks
- David Stokessays:
Great commentary, but perhaps you could improve by employing proof readers of only average or low IQ.
Continue and expand bracketed translation of economic jargon. Try employing a cartoonist to depict the entities that are at play as components of or manipulators of our financial fate. Visualisation and humour can leapfrog hundreds of words!
Small common sense businesses and savers appreciate and need all the help you can provide to get them through this ponzi swamp.
- ez scott says:
Matt,
Thank you so much for your breaking down of this current insanity we call the stock market. I am greatful for your precise explainations.
Scott.