
Proof of Overvalued Markets?
Below, we look at Robert Shiller’s famous CAPE multiple/indicator to consider the question of overvalued markets. We’ll look at what the CAPE is, what it’s telling us, whether it matters—or should matter—and how we here at SignalsMatter.com place the CAPE in the greater context of calmly understanding these record-breaking markets.
A Picture Says a Thousand Words
Many are wondering about overvalued markets, market prices, market peaks or further market lift-off. In the backdrop of record highs, many are asking if these are a tiny bit overvalued markets, massively overvalued markets or just a rational mirror of a strong economy and a random walk down Wall Street?
To put the rationality of these markets in some visual perspective, here’s a look at what the S&P has been doing. Notice the movement since 08? Does that look or feel “rational”?
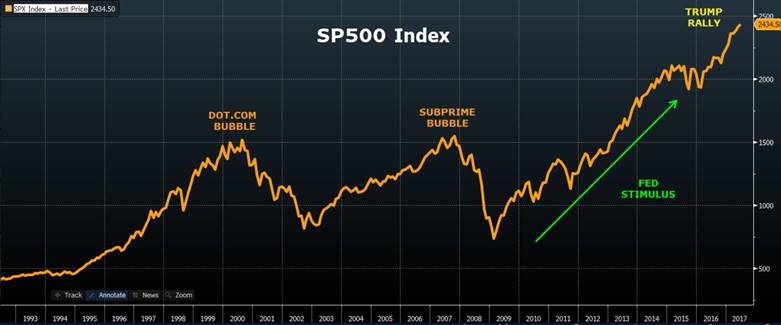
Many also know that our take here at Signals Matter is that these markets are not a rationally priced reflection of a strong Main Street or a rational Wall Street. Nope. We think rational pricing left the building years ago.
Instead, today’s admittedly generous markets are the smoking gun evidence of distorted pricing handed down to us by central bank monetary policies unleashed in the rubble of the 2008 crisis.
In case you’re wondering what almost a decade of Fed stimulus ($4T in Quantitative Easing and 120+ months of anemic interest rate crushing) can do to creating a market bubble, just look at the correlation below to the Fed and the S&P:
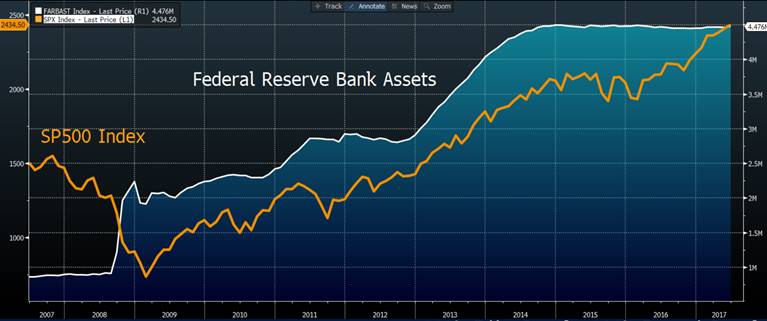
Perhaps you are thinking correlation is not the same as causation. Perhaps you’re thinking that markets are fairly priced and a reflection of booming earnings and a political miracle. If so, let’s consider valuations.
The CAPE Multiple as a Measure of Market Valuation
If these pictures don’t speak a thousand words about market distortion and central bank correlation, we may want to consider that once-sacred indicator and/or warning of market valuation, the CAPE, aka the “Cyclically Adjusted Price/Earnings” multiple of which Yale professor Robert Shiller keeps trying to remind the rest of the world.
Currently, Robert Shiller’s indicator is saying very clearly that US stocks are over-priced/expensive. In fact, the CAPE has been saying this for a very long time.
But before we get too bearish or cynical, let’s first consider what the CAPE is, as well as what is helpful and problematic about its efficacy as a market indicator.
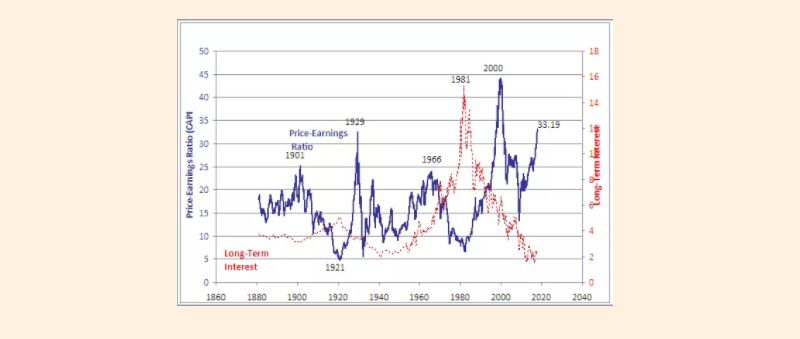
So, what is the CAPE multiple? It basically measures whether a stock price/index is over or under valued based upon measuring the ratio (or multiple) of its current price to its inflation-adjusted historical earnings record for a period of 10 years. In short, it’s a sexier iteration of the PE (price to earnings) ratio—just stretched out over a longer cycle.
By measuring/extending average earnings over the last decade rather than just current earnings ratios, the CAPE is intended to adjust for business cycles and “extraneous events” like headlines, political scandals, market outliers etc. to create a smoother, more dependable assessment of market valuation.
The CAPE, moreover, is not necessarily a signpost of market corrections or crashes ahead, though high CAPE multiples have consistently been correlated to subsequent sell-offs. Today’s CAPE multiple of 32.2, by the way, is very, well: high…
What is the CAPE Telling Us?
This CAPE multiple, in fact, is higher than it was on the eve of the Great Depression/Crash of 1929, a level surpassed only once thereafter during the last two years of the dot.com bubble of 2000 when over-valuation reached its peak.
Does anyone fear the CAPE anymore?
Shouldn’t this alarm us?
Well, yes, perhaps it should.
But it doesn’t. Why?
There are some reasons why the CAPE demands some fair criticism. Robb Arnott’s recent examination of the CAPE notes that the CAPE multiple has always and historically trended upward over time. Arnott then created a new baseline, so that markets don’t get too scared about the current numbers. Fair enough.
As Robb Arnott argues, in the many decades since the crash of 29, the fact that today’s CAPE numbers are higher than at the eve of even the greatest market crash in US history does not automatically imply markets are, or should feel, as overvalued as they were then.
Another common criticism of the CAPE is that because its price to earnings ratio goes back ten years, its PE multiples will be low when earnings are high and high when earnings are low. If any ten-year window, for example, includes a profit cycle with unusually low earnings, such as following the 08 Credit Crisis, CAPE numbers will spike up dramatically, as they have done now.
Stated otherwise, they argue that the reason we have such a high CAPE multiple today isn’t necessarily because securities are over-priced, but simply because we had that unfortunate outlier called the Great Recession in 08 which upset the numbers.
Once that pesky 08 Crisis drops from the 10 year cycle, critics argue, the CAPE (and hence market valuations) won’t look so big and scary.
One problem with this criticism of the CAPE, however, is that you can’t just ignore the data you don’t like—such as the 08 crisis, as an outlier, and make an excuse for it.
Furthermore, even if you want to dismiss that big drop in earnings in 08 which caused a big spike in the CAPE multiple, you can’t simultaneously have it both ways by then retaining data regarding the big drop in the CAPE multiple that directly resulted from the massive rise in earnings handed to us by the Fed stimulus and market “recovery” in earnings by 2010.
If we account for this huge “dip and climb” in earnings in that 2 year window between 2008 and 2010, the CAPE still comes out at 27.3, which is ominously high and suggests significant over-pricing of stocks in today’s markets.
In short, we are basically paying $20.00 for a $1.00 “snickers” bar when diving into today’s S&P, DOW, RUT or NASDAQ.
Should We Care about the CAPE?
If you like over-paying, then I guess this CAPE indicator is not something you need to fear… After all, if you pay $20 for a candy bar, that’s not a bad idea, as long as you can find a greater fool to buy it tomorrow for $22.00. And in these crazy markets, there are plenty of greater fools out there.
Furthermore, the CAPE is only one indicator among many indicators, and a handy tool for bears or bulls alike to twist and turn to their delight to make a point. Market commentators can tweak data with as much skills as statisticians can twist and turn any figure to their advantage as we’ve seen with Ex-Items earnings or BLS inflation data.
In short, it’s hard to make sense of anything in this everything bubble. Frankly, the more simple reality, as we see it, is this: in markets this distorted by unprecedented central bank steroids, market irrationality can break new records in duration of over-pricing because we have broken new records in market stimulus. Using traditional risk/valuation tools like the CAPE (Var, standard deviation etc) to measure non-traditional markets is akin to using a ham radio rather than a cell phone to measure voice clarity.
In short, everything has changed. These markets have no precedent, and as such, relying only on traditional theories or tools is not enough.
What We Think of the CAPE
That’s why we at SignalsMatter.com don’t trade on one or two indicators alone, or even basic valuation metrics in general, for anyone who knows markets today also knows that fundamentals like “value” have essentially left these markets long ago. Just consider the FANGS, the Russell 2000 (trading at a 110 PE) or Tesla. But I digress…
The markets, as we monitor them, are traded mostly on price action, not valuation basics, which is a bit sad, but that’s what happens when central banks (and the “animal spirits” they inspire) determine price rather than supply and demand. Alas, why fight it: it is what it is…
So, we currently accept rather than fight reality (however distorted) and recognize that capital flows drive markets right now far more than valuation or common sense. Such human irrationalism, at least, is nothing new. As a result, no one fears the CAPE, just as no one fears the idea of a big bad market wolf (i.e. recession) when new market records are broken with each passing week. All eyes are on the upside, not the downside in periods of euphoria.
Given the “steroids” or market “cocaine” handed to the securities markets in the rubble of 08, this trend can continue for much longer, and we are agnostic as to whether these trends are sane or insane, healthy or unhealthy. They are, after all, trends. And so, we continue to beat the indices by providing our subscribers with daily Trend Watch updates and signals.
But that doesn’t mean we aren’t keeping our eyes out for that big bad market wolf, iceberg, recession or whatever you wish to call it.
At some point, after all, the debt and media buzz that feeds this market trend will hit its much deserved wall, for an economy, as well as even a robo-traded market, that lives off debt, fantasy budgets, tax “reform” and more debt rather than productivity, eventually realizes that living off a VISA rather than an income will end worse than where they started.
Until then, be careful out there, ride this market wave as long as it has juice, which it does. We just ask that you prepare for the rocks beneath that wave. If you are a subscriber to our signals, we’ll help you track the surf conditions.
For now, surf’s up and fear of the CAPE, like caution in general, has left the beach.
See you in the line-up, but please: watch for those rocks…