Below we look at the 2018 S&P earnings myth and the most recent real estate data from the Fed as to single-family housing numbers.
Uncomfortable Calm?
I’ve been traveling a lot. Sunny spots, rainy spots, cities, beach towns, horse trails, jazz bars and even martini bars. And yet wherever I turn, regardless of the continent, language, accents, beer or surf conditions, people seem nervous.
From politics to markets, headlines to NFL sidelines, there’s a sense we are living in a kind of uncomfortable calm of collective uncertainty. That is, there is a growing sense of disconnect between what is reported and what is felt.
As many know: I am big on saying what I feel. Blunt is better than spin.
This blog, however, is less about existential angst or social commentary and more about markets—so let’s turn to investing…
The S&P Earnings Myth
As we head into the last quarter of fiscal year 2018, I highly recommend a quick peak at my 2018 Fall Market Video Update.
In this video, I take a deeper look at the math behind the “earnings surge” on the S&P, which has nothing to do with: 1) “robust corporate profits” (flat since 2011), 2) Main Street confidence (which ignores unreported employment pains) or 3) natural supply and demand (which the Fed abolished in 2009).
Instead, 2018’s so-called “earning surge” is the result of: 1) a one-time tax cut steroid and 2) $2.5T a year in stock buy-backs.
In short: markets party when rates are low and the borrowing costs for buy-backs and dividends are cheap; the hangover comes when rates go up and the borrowing costs for the party get higher than its party-goers.
Here it is in a nutshell: thanks to the Fed’s “engineering” of post-08 rates to the zero-bound, the S&P pays $19/share to cover its debt expenses. If rates go up just 170 basis points, that debt expense climbs to $50/share.
And when that happens, earnings will tank, and so will the markets.
So, if you want to know where stocks are heading, look at the bond market, not the S&P…
Alone in the Fog
Needless to say, as our grossly distorted markets sail slowly into a debt-driven hurricane despite the best intentions of a bubblehead financial media that sells spin rather than candor, the average investor can easily get lost (or feel alone) in the fog.
I’ve written about stocks like Tesla, for example, or Facebook, Netflix and Amazon. And I warned about Bitcoin at the beginning of the year…It’s all very amusing and telling, even eerie.
Take Elon, for example. As predicted the SEC is coming down on him even harder than I did…
But wasn’t it fun to short Tesla? Or Even Bitcoin? I hope you did…
And this week, all eyes have been on the Supreme Court hearings, which, regardless of your views on who is right or wrong, have shown just how swampy our DC swamp really is. These are scary times.
But not scary at all for the omni-smiling market cheerleaders or the Washington careerists at the Fed who only sell positive spin. They do this brilliantly, right up until the dire end.
Remember 08? Just before markets lost 12 TRILLION, the Fed was forecasting more good news.
BS Alert—Housing Data
Well, nothing has changed. Just yesterday the Fed’s pom-pom squad was bragging about rising single-family home sales. The financial press, needless to say, jumped on the rosy bandwagon, as the 24-hour news cycle spends more time cheering than fact-checking.
But facts, as I often say, are pesky little things, and I feel compelled to address rather than ignore them.
As for single-family home sales, the fact is they are in the basement of history, not the height of a recovery.
Really?
Yep. Really.
When yesterday’s much celebrated sales rate of 627,000 units was announced, the prompt-readers failed to mention that those were the same numbers posted in 1971…
Which means in the last 47 years, during a period when the US population has grown by 60%, single-family housing unit sales are right in the basement of time—as is the real Main Street “recovery.”
You may not want to believe me (or David Stockman and others who track this stuff brilliantly), so let’s just look at the data. The red-line below shows housing sales, the blue line shows population growth:
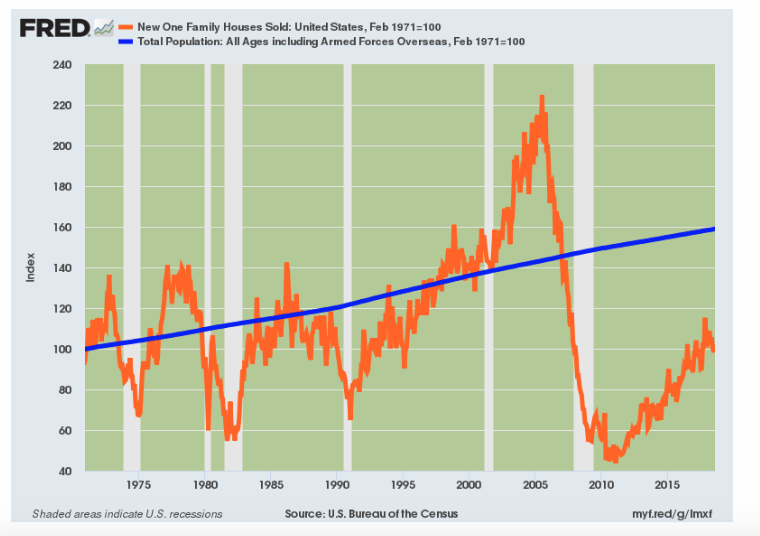
Look like a “boom” to you?
In other words, don’t believe everything you hear about the “recovery.” And if you are a real estate broker—my advice is to sell as many houses as you can before rates rise and that bubble pops too…again.
Nor should the rest of you believe everything you hear about the markets. Unlike the 1970’s, when inflation was surging right before our eyes, today we are seeing the same inflation—only this time in asset bubbles (i.e. stocks and bonds) rather than long lines at the gas stations.
But in both cases—it always ends the same way: badly.
I know I sound like a downer as markets are enjoying an upper.
But if you are sober rather than delusional investor, you should be looking at facts, rates and yields, not newscasters, headlines or fog.
Or even more simply—just subscribe to our market signals…
In the interim, be careful out there.