Key market indicators still matter today despite a now totally artificial market hidden behind (supported by?) a media circus-show that is rich on drama yet poor on facts.
Luckily, SignalsMatter sticks more to the latter and less to the former.
Key Market Indicators—Headline Tailwinds Ahead?
Markets in search of any kind of good news are hoping that the President’s recently announced 3-Phase emergence plan from the COVID-19 business-lock-down may add some tailwinds to a now undeniably centralized stock market.
Is this easing of the shutdown a good idea? A safe idea? A necessary idea?
There’s no point in Tom or I taking a political stand in a market report, as our readers need math, facts and signals not red or blue cheer-leading, apologies or water-cooler talk.
The same is true for the increasingly polarized debate on the justices or injustices of the COVID lock-down itself.
Why?
Because we track markets and build portfolios rather than grandstand our political views. That said, we try to respect and provide perspective for our readers, as politics–including off the charts deficit-spending–do impact markets and portfolios.
The Current Lock-Down Debate— Key Market Indicator, or Just White Noise?
There’s a big debate heating up as to the retrospective wisdom and/or necessity of an economic lock-down.
On the one extreme, we see armed and angry Michiganders protesting for their right to individual freedoms and liberties, reminiscent of Ben Franklin’s (sans automatic rifle) observation that “those who surrender their liberties for security deserve neither.”
Alas, the first pitch forks (or AR-15’s) are thus out…Americans are demanding the right to make their own choices and are protesting against imposed restrictions on their liberty.
And on the other extreme are those demanding emergency measures to keep people quarantined for their own good at any cost-civil liberties be damned.
Such pro-quarantine (and media-supported) stances are daily endorsed by what David Stockman describes as the “morbid, sensationalized CNN/Cuomo Brothers/MSM/infectious disease lobby’s Covid Death Watch” fixation which “has spawned a hysteria among officialdom and much of the broad public that is literally killing economic function and rationality.”
In short, somewhere amidst all this polarization is a credible dividing line which requires a legitimate recognition of three undeniably important yet currently conflicting visions for our nation: 1) to save and protect lives, 2) to respect individual liberties and 3) to save and protect the economy.
Do Tom and I have the political solution? One that would satisfy one and all?
Nope.
Thus, we’ll stay off the soap box today.
What we can speak to, however, are the facts and key market indicators resulting from the lock-down as they pertain to the markets in general and your portfolio in particular.
Toward that end, just what key market indicators can we see and share as of this first Friday after Easter?
Well, there’s a lot. Let’s look, then, at some of these key market indicators.
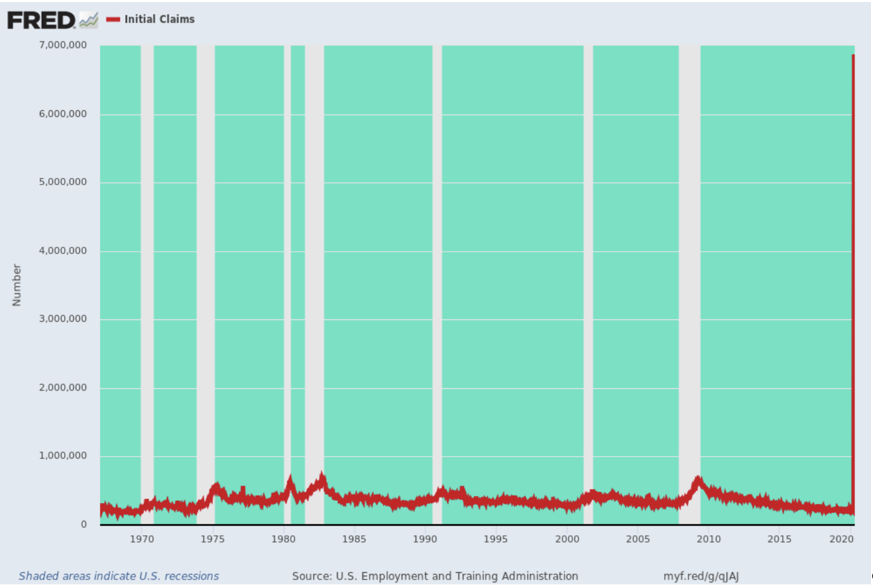
Unemployment Rises
Whether you applaud or detest the lock-down measures over the wide swaths of non-essential U.S. businesses, there’s no denying the lock-down’s impact on the unemployment numbers.
As of this writing, 22 million jobs were lost in the last 4 weeks.
What’s equally noteworthy about this data from the Bureau of Labor Statistics (BLS) is that this 22 million figure of American job losses is the exact same number of job gains which the BLS said were created in the 11+ years since the Great Financial Crisis (GFC) of 2008.
In short, everything that has been gained since the GFC has now been lost in less than a month, making the COVID crisis greater in shock value than 9-11 or Lehman Brothers combined.
In fact, the number of jobless claims posted in the last month alone are 10X greater than the worst week posted during the 2008 GFC.
Economic Coup or Just an Emergency Reality?
There are some, including Mr. Stockman, who believe the viral threat was not worth this kind of “imposed shutdown” job loss, citing data from NYC that the death rate for this virus impacts those over the age 80 at a 1500X higher rate than those under 30 or even 50.
Given such statistics, he (and many others) argue that it would therefore have made 1500X more sense to simply isolate the elderly and other high-risk categories rather than the entire nation.
Such views further maintain that what we are essentially witnessing now is $5T coup of big government, Wall Street “accommodation” and Fed control masquerading as a national “care package.”
Fair enough. We should at least give some thought to this.
But there are others, of course, who equally and legitimately feel that no market or employment statistic can possibly compare to the value of a human life, especially given the specific risks COVID-19 places upon our elderly population to which so much is owed by this nation.
Again—a legitimate and fair point, one deserving obvious respect.
But a topic equally worthy of our attention and respect is the economic health of our country. Luckily, this is an issue supported by fact rather than opinion.
Let’s dig in.
Manufacturing Declines
Key market indicators (i.e. facts) keep pouring in, including a manufacturing statistic from the great state of New York which reveals a negative reading of 78, a decline which surpasses numbers seen after both the dot.com crash of 2000 and the GFC of 2008.
And outside of the Empire Stare, national manufacturing output is projected to fall by at least 25% for April, which may explain why folks were packing guns (modern pitch forks) at the recent protest in Michigan, my (and Mr. Stockman,s) home state.
Go Blue?
In short, people are suffering and angry, and not just worried about getting sick. They are worried about their livlihoods as much as their lives.
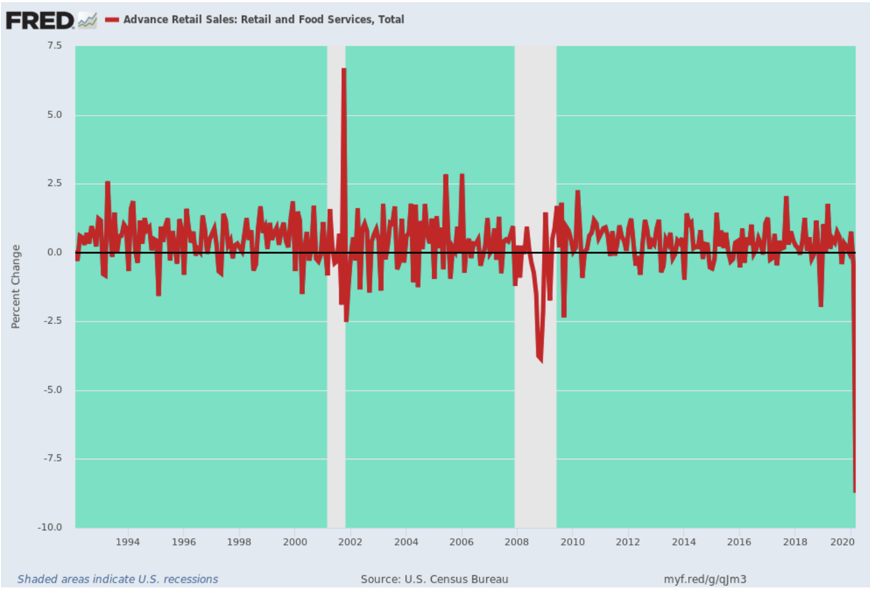
Retail Sales Tanking
During the month of March, total retail sales across the nation fell by 8.7% and that number is predicted to decline by an additional 4X for the month of April on a month-to-month-basis.
Auto Sales Decline Big Time
Auto sales (for which my dear Detroit is fairly well-known) for the month of March fell by 27% and are projected to fall by greater than 50% for the month of April.
The sheer speed and size of such declines has not been seen since the Great Depression of the 1930’s.
Budget Deficit Soars
In effort to quell some of this economic bleeding, the government has been deficit spending like a hipster with a new Amex card.
Goldman Sachs has projected that the budget deficit for just the Fiscal year of 2020 alone will reach $3.6T, and rise to $6T by 2021.
Folks, that’s a lot of trillions that we as a nation don’t otherwise have today, which means my sweet and brilliant daughter, who just happens to work for Goldman Sachs, will, along with her entire generation, be saddled with this bill…
Sorry Sweet Pea…But MY generation is borrowing against YOUR generation’s future. Good luck at Goldman…
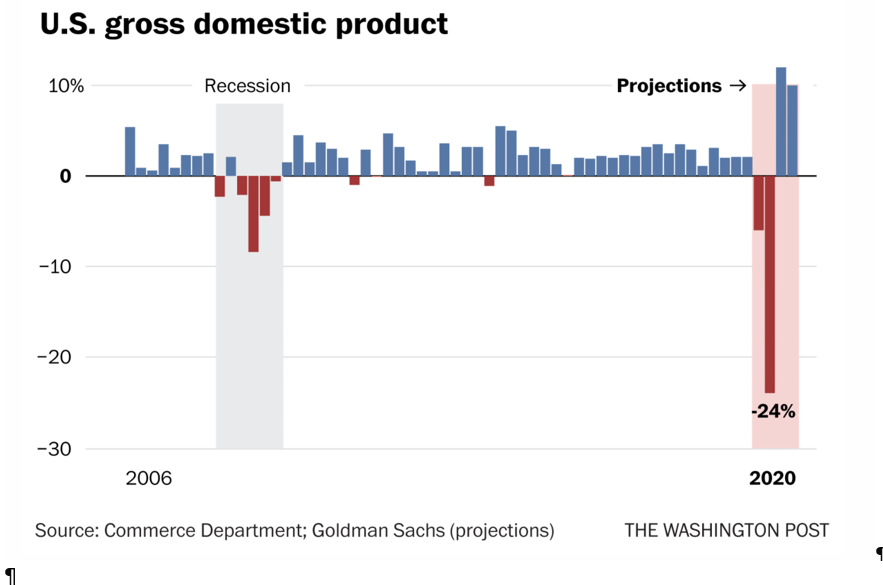
GDP Nosedives
The folks at Goldman Sachs are being no less shy about the projected GDP losses ahead, as the following chart makes eerily clear…
More Money Printing to the Moon
Needless to say, with GDP (i.e. national income) nosediving, Uncle Sam will need to be issuing a ton of new IOU’s (i.e. Treasury Bonds) going into 2020—at least $2.5T worth.
Who will by Uncle Sam’s debt?
That’s easy: It will be Uncle Fed just a few blocks around the corner.
And how will Uncle Fed pay for it?
That’s easy too: Uncle Fed will just print more fiat dollars and pretend that such a “solution” will have no impact on the purchasing power of those otherwise sacred U.S. greenbacks, enough created in the last month to make even Bernanke bow his head in awe…
For those, however, who prefer reality over pretend, I’d suggest a second look at my report on gold, here, as a hedge against such inevitable currency risk once the current deflation scenario morphs into an inevitable inflationary scenario, a reality that pro-money printers simply ignore.
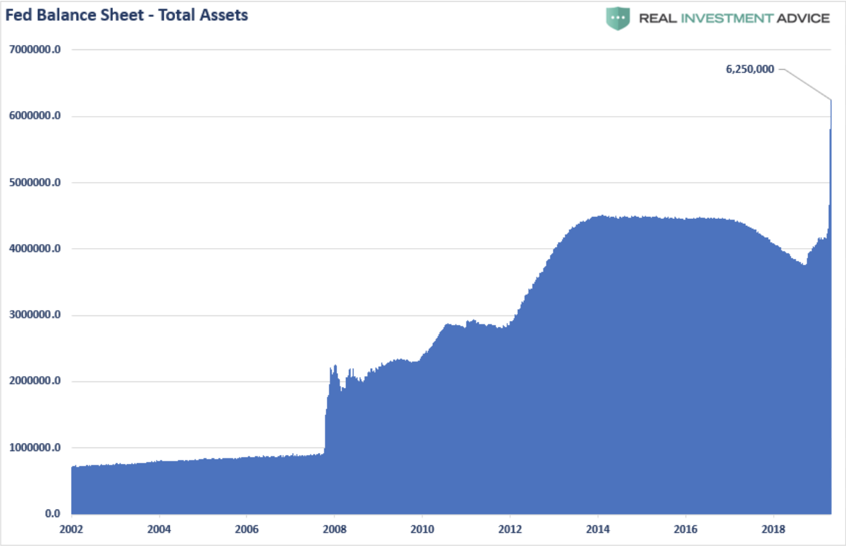
These first days of unlimited QE have already taken the Fed’s balance sheet from $4T to $6.2T, which is more money created out of thin air in the last 30 days than was created in the first 95 years of the Fed’s entire existence.
Folks, please read that last line again in case you aren’t yet convinced that we are now in a Fed market which has taken us right out of the Twilight Zone and now dead center into the Danger Zone of monetary policy gone mad.
Or for those who feel that a picture is worth 6.2 trillion words, just take a look (way up and to the needle-peak right) at this staggering graph of the money-printing absurd:
What Do Such Key Market Indicators Mean for Your Portfolio?
Folks, we are now at an historical tipping point in the history of our Nation. I simply can’t stress this enough. Period. Full stop.
Regardless of what legitimate and passionate views you may have for or against the economic lock-down at a personal level, none of us can deny the factual impacts we are now experiencing at an economic level.
The simply staggering levels of Uncle Fed money creation to pay Uncle Sam’s current and future debts will have a direct impact on keeping bond prices up and hence bond yields and rates down. This is semi-bullish news for the short-term.
My readers, of course, know very well that I’ve always been cynical of the Fed…
For now, however, there’s just no point in fighting this Fed, for not even in my most cynical moments of monetary despair did I ever think I’d see this kind of Fed “support.” The Fed’s balance sheet is expected to hit $10T by 2021.
I’m literally flabbergasted. Even such horrific key market indicators as listed above are no match for this kind of money-printing and a Fed gone wild.
In the near-term, the market meltdown of which I’ve passionately written many times, will likely be contained, as trillions do indeed buy the markets something.
But for how long?
I have no clue. I just know it ends really, really badly.
For now, however, the 60%-80% declines in the stock market which we would otherwise be experiencing right now have been buoyed up by hitherto unimaginable Fed “intervention”–i.e. printed money and budget deficits at levels never seen before or imagined in our nation’s history.
As I’ve written many times before, such “Fed intervention” is really nothing more than “Fed experimentation,” and in every dangerous experiment of such historical magnitude, timing the result is nearly impossible.
Expecting, and hence preparing for it, however, is NOT impossible.
That is why we balance the known risks of this experiment against the uncertainty that comes with it.
And remember, risks can be managed, uncertainty can’t.
For subscribers to SignalsMatter, I ask you yet again to login here and see our latest, and still cautious approach to keeping your portfolio both safe yet opportunistic in these unprecedented times—as there’s always a smart way to balance the known against the unknown, which is why and how we make money in all conditions, bear to bull—and even the surreal.
To that end, risk management is, and always will be, the way we win this rigged to fail game over the long-haul.
Key market indicators like those shared above are just an example of what we consider on a daily basis. For subscribers, we do a lot more.
Steady as she goes folks, and we’ll be back on Monday with more to keep you informed.
Sincerely,
Matt & Tom
and ,somehow, many are expecting a V shaped recovery! Some people have Covid for brains.
Give me liberty OR give me a $1,200 check!
Thanks John. Even if we get a U-shaped recovery, the V would only prove how distorted markets are, and no one in DC or the Fed could deny that. trillions buy time, but one day, the “karma” for all this QE and Debt is going to land very hard on the USA. For now, all we can do is track the signals, albeit very “stimulated” signals indeed…
I generally agree with all that you say, and have been trying to follow your advice, but at times I do not understand. A few weeks ago when the market hit bottom the feds told us that they would pump as much money into the market as needed to support it and I did catch part of that wave, but I held off on going in big because your advise was to increase cash. l am now looking at getting off of this wave and then wait. If you cannot ride these waves how can we make any money because the whole market has become a scam? Again, I am not saying I do not agree with your fundamentals, it just that the feds can do whatever they want until they are literally overthrown, so how can they really be stopped?